
In this room, we will learn how to utilize the Kibana interface to search, filter, and create visualizations and dashboards, while investigating VPN logs for anomalies. This room also covers a brief overview of Elasticstack components and how they work together.
Learning Objective
This room has the following learning objectives:
- How to perform searches, apply a filter, save search.
- How to create visualizations.
- Investigate VPN logs to identify anomalies.
- To create a dashboard using saved searches and visualizations.
A US-based company CyberT has been monitoring the VPN logs of the employees, and the SOC team detected some anomalies in the VPN activities. Our task as SOC Analysts is to examine the VPN logs for January 2022 and identify the anomalies. Some of the key points to note before the investigation are:
- All VPN logs are being ingested into the index
vpn_connections. - The index contains the VPN logs for January 2022.
- A user
Johny Brownwas terminated on 1st January 2022. - We observed failed connection attempts against some users that need to be investigated.
Elastic stack
Elastic stack is the collection of different open source components linked together to help users take the data from any source and in any format and perform a search, analyze and visualize the data in real-time.
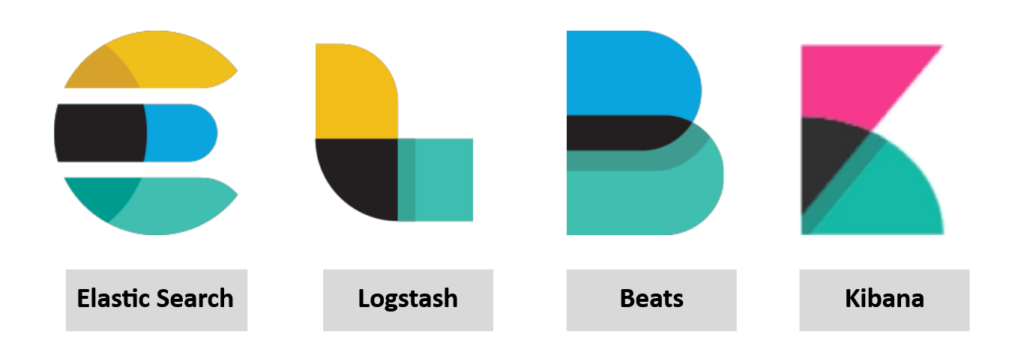
Let’s explore each component briefly and see how they work together.
Elasticsearch
Elasticsearch is a full-text search and analytics engine used to store JSON-formated documents. Elasticsearch is an important component used to store, analyze, perform correlation on the data, etc. Elasticsearch supports RESTFul API to interact with the data.
Logstash
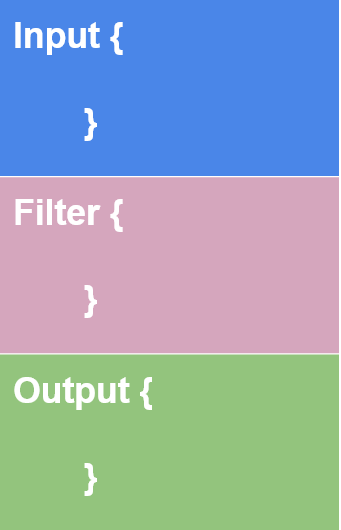
Logstash is a data processing engine used to take the data from different sources, apply the filter on it or normalize it, and then send it to the destination which could be Kibana or a listening port. A logstash configuration file is divided into three parts, as shown below.
The input part is where the user defines the source from which the data is being ingested. Logstash supports many input plugins as shown in the reference https://www.elastic.co/guide/en/logstash/8.1/input-plugins.html
The filter part is where the user specifies the filter options to normalize the log ingested above. Logstash supports many filter plugins as shown in the reference documentation https://www.elastic.co/guide/en/logstash/8.1/filter-plugins.html
The Output part is where the user wants the filtered data to send. It can be a listening port, Kibana Interface, elasticsearch database, a file, etc. Logstash supports many Output plugins as shown in the reference documentation https://www.elastic.co/guide/en/logstash/8.1/output-plugins.html
Beats
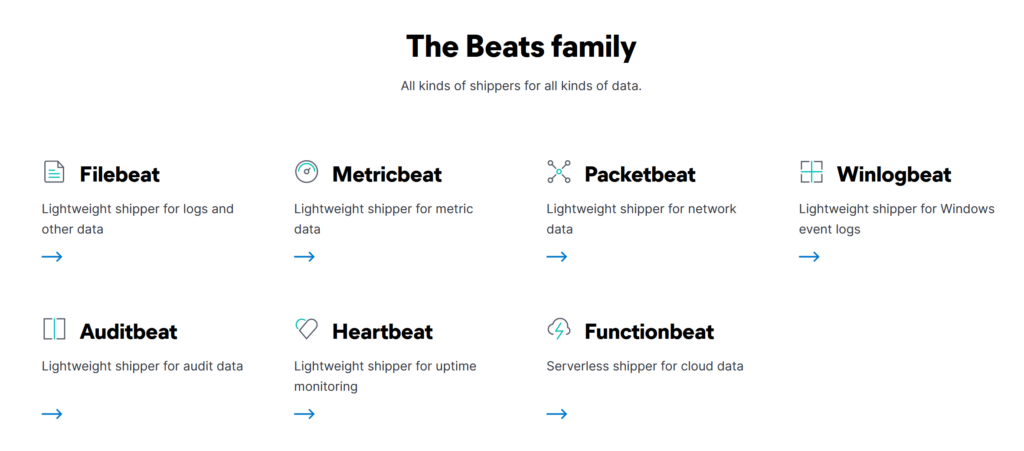
Beats is a host-based agent known as Data-shippers that is used to ship/transfer data from the endpoints to elasticsearch. Each beat is a single-purpose agent that sends specific data to the elasticsearch. All available beats are shown below.
Kibana
Kibana is a web-based data visualization that works with elasticsearch to analyze, investigate and visualize the data stream in real-time. It allows the users to create multiple visualizations and dashboards for better visibility—more on Kibana in the following tasks.
How they work together:
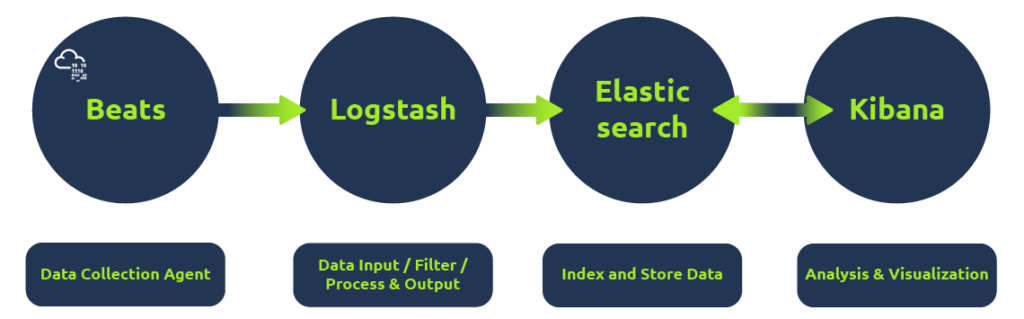
- Beats is a set of different data shipping agents used to collect data from multiple agents. Like Winlogbeat is used to collect windows event logs, Packetbeat collects network traffic flows.
- Logstash collects data from beats, ports or files, etc., parses/normalizes it into field value pairs, and stores them into elasticsearch.
- Elasticsearch acts as a database used to search and analyze the data.
- Kibana is responsible for displaying and visualizing the data stored in elasticsearch. The data stored in elasticseach can easily be shaped into different visualizations, time charts, infographics, etc., using Kibana.
Logstash is used to visualize the data. (yay / nay) Nay
Elasticstash supports all data formats apart from JSON. (yay / nay) Nay
As we already covered a brief intro of Kibana. In this room, we will explore different Kibana features while investigating the VPN logs. Kibana is an integral component of Elastic stack that is used to display, visualize and search logs. Some of the important tabs we will cover here are:
- Discover tab
- Visualization
- Dashboard
Room Machine
Before moving forward, Connect via VPN and deploy the machine or start AttackBox. When you deploy the machine, it will be assigned an IP Machine IP: MACHINE_IP. The machine will take up to 3-5 minutes to start, then the interface will be accessible via the IP.
Username: Analyst
Password: analyst123
Kibana Discover tab is a place where analyst spends most of their time. This tab shows the ingested logs (also known as documents), the search bar, normalized fields, etc. Here analysts can perform the following tasks:
- Search for the logs
- Investigate anomalies
- Apply filter based on
- search term
- Time period
Discover Tab
Discover tab within the Kibana interface contains the logs being ingested manually or in real-time, the time-chart, normalized fields, etc. Analysts use this tab mostly to search/investigate the logs using the search bar and filter options.
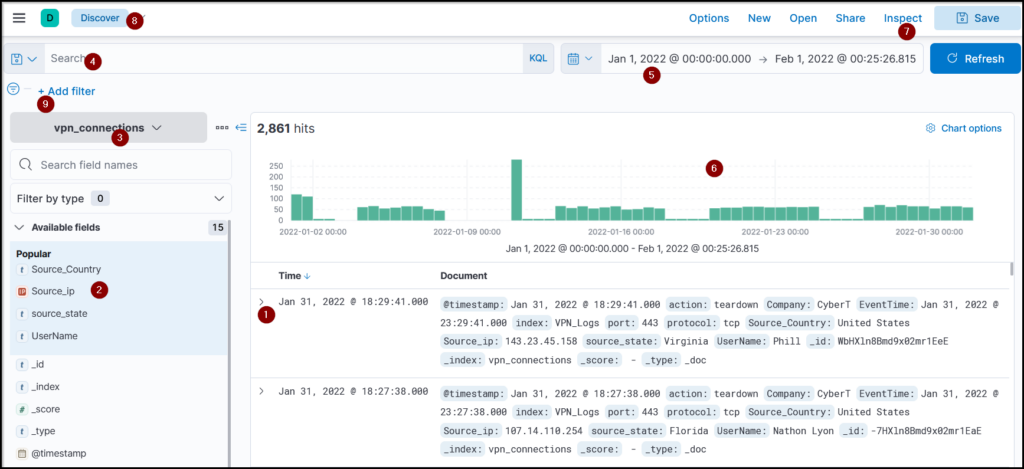
Some key information available in a dashboard interface are
- Logs (document): Each log here is also known as a single document containing information about the event. It shows the fields and values found in that document.
- Fields pane: Left panel of the interface shows the list of the fields parsed from the logs. We can click on any field to add the field to the filter or remove it from the search.
- Index Pattern: Let the user select the index pattern from the available list.
- Search bar: A place where the user adds search queries / applies filters to narrow down the results.
- Time Filter: We can narrow down results based on the time duration. This tab has many options to select from to filter/limit the logs.
- Time Interval: This chart shows the event counts over time.
- TOP Bar: This bar contains various options to save the search, open the saved searches, share or save the search, etc.
Each important element found in the Discover tab is briefly explained below:
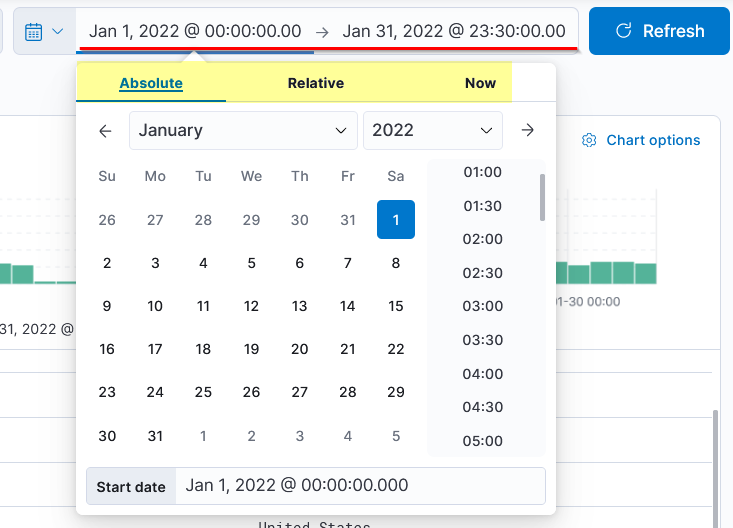
Time Filter
The time filter allows us to apply a log filter based on the time. It has many options to choose from.
Quick Select
The Quick Select tab is another useful tab within the Kibana interface that provides multiple options to select from. The Refresh, Every option at the end will allow us to choose the time to refresh the logs continuously. If 5 seconds is set, the logs will refresh every 5 seconds automatically.
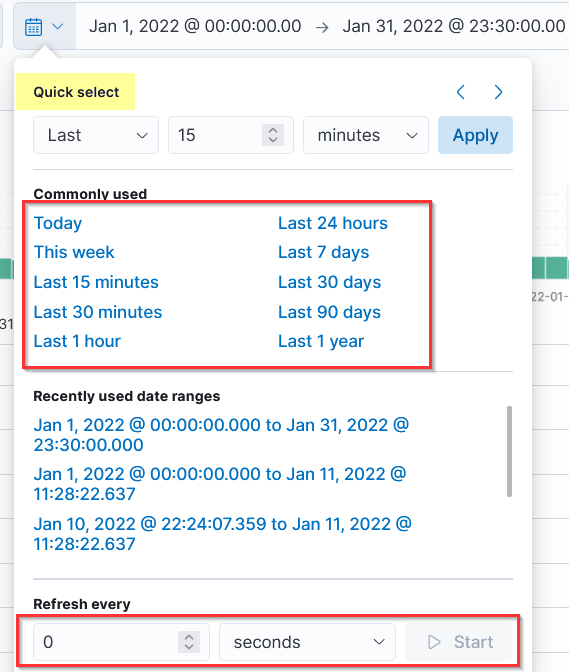
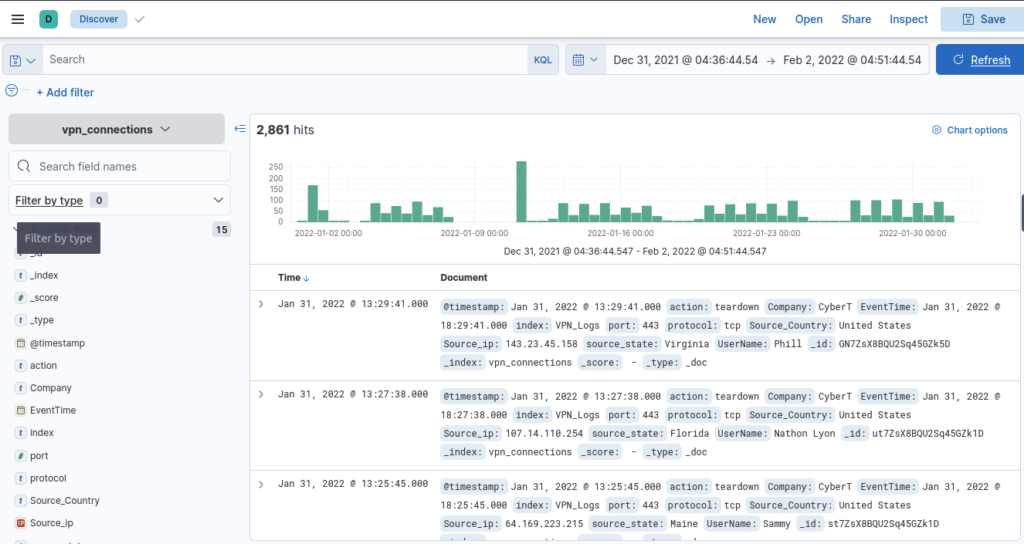
Timeline
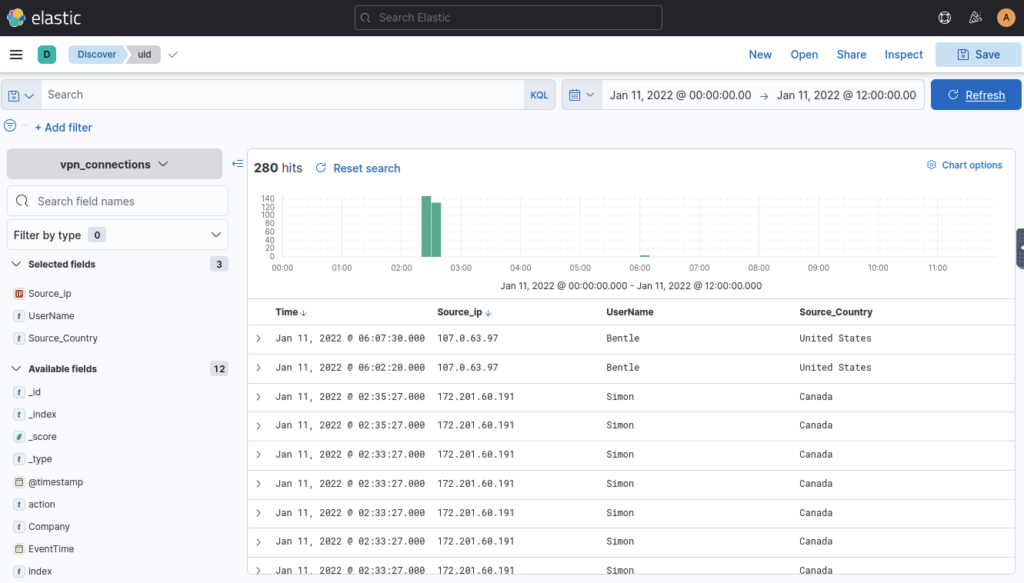
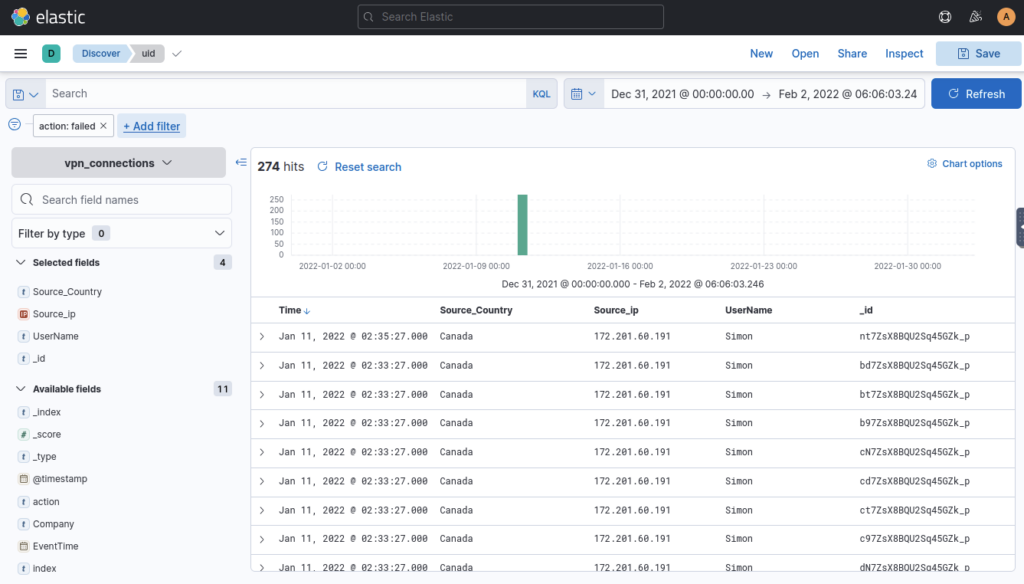
The timeline pane provides an overview of the number of events that occurred for the time/date, as shown below. We can select the bar only to show the logs in that specified period. The count at the top left displays the number of documents/events it found in the selected time.
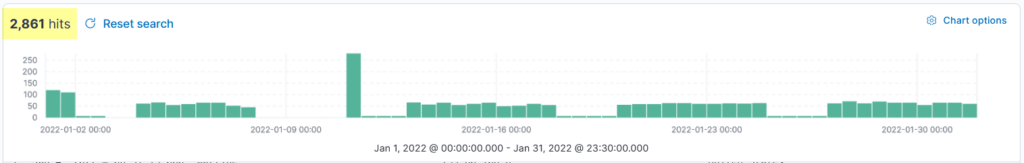
This bar is also helpful in identifying the spike in the logs. We got an unusual spike on 11th January 2022, which is worth investigating.
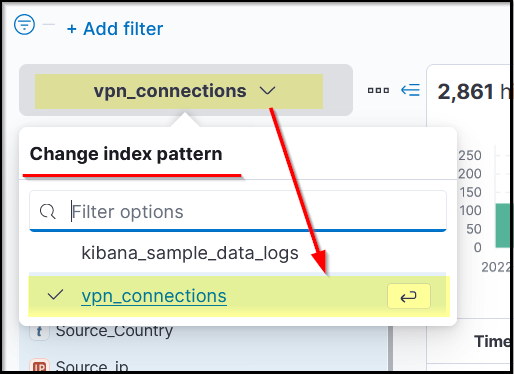
Index Pattern
Kibana, by default, requires an index pattern to access the data stored/being ingested in the elasticsearch. Index pattern tells Kibana which elasticsearch data we want to explore. Each Index pattern corresponds to certain defined properties of the fields. A single index pattern can point to multiple indices.
Each log source has a different log structure; therefore, when logs are ingested in the elasticsearch, they are first normalized into corresponding fields and values by creating a dedicated index pattern for the data source.
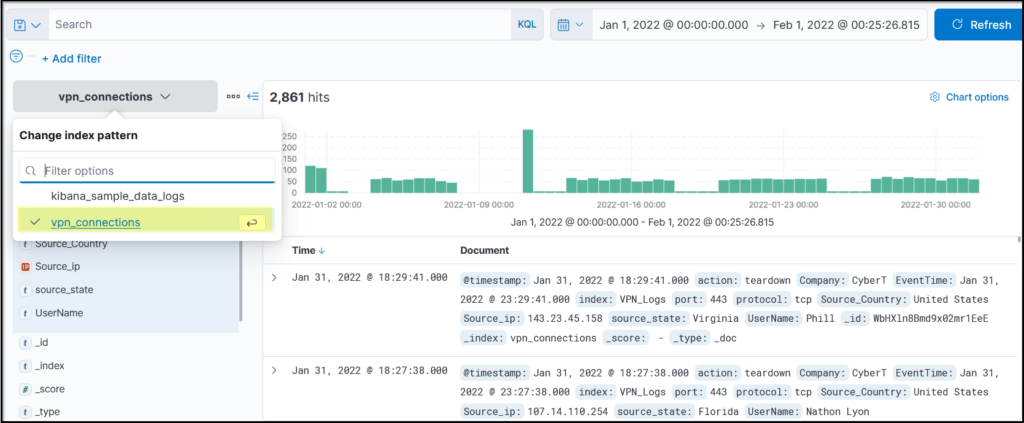
In the attached lab, we will be exploring the index pattern with the name vpn_connections that contains the VPN logs.
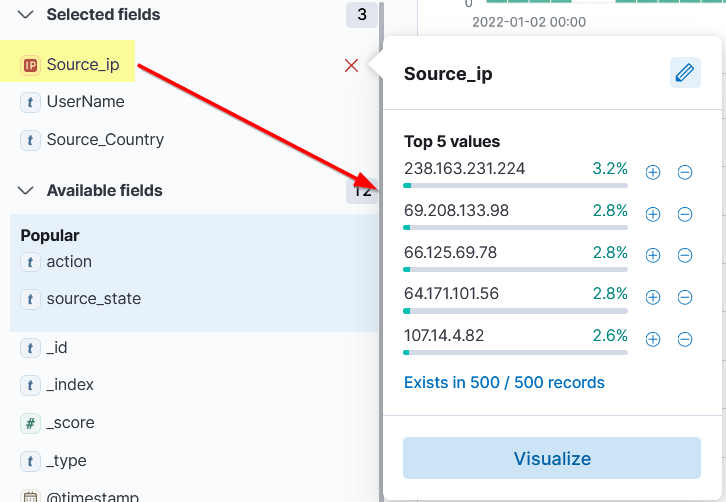
Left Panel – Fields
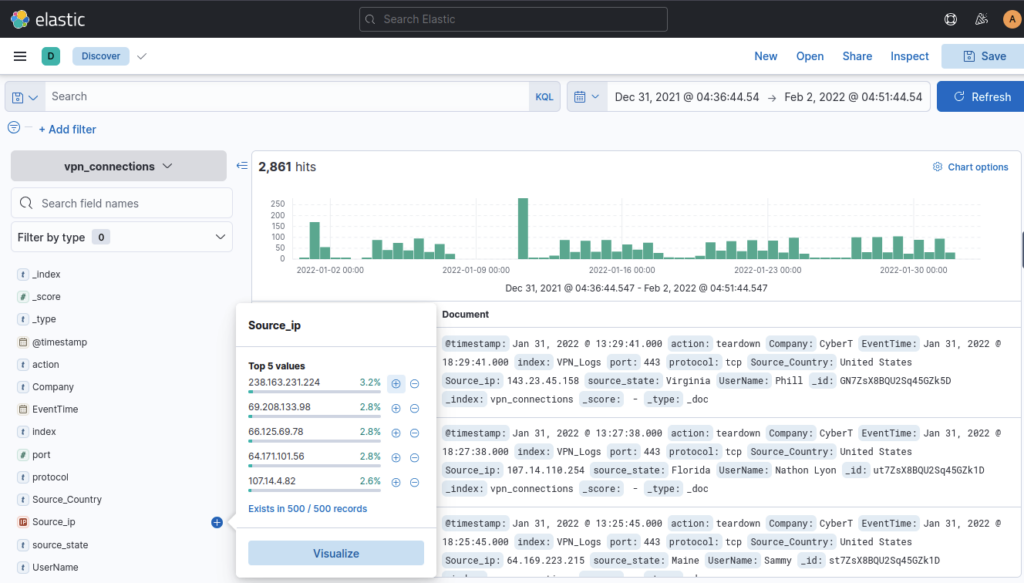
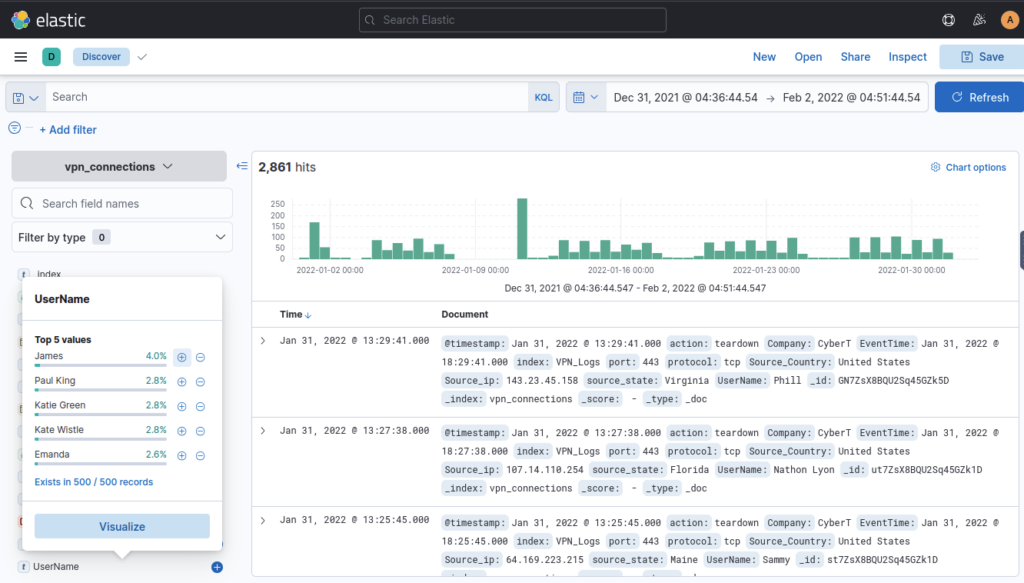
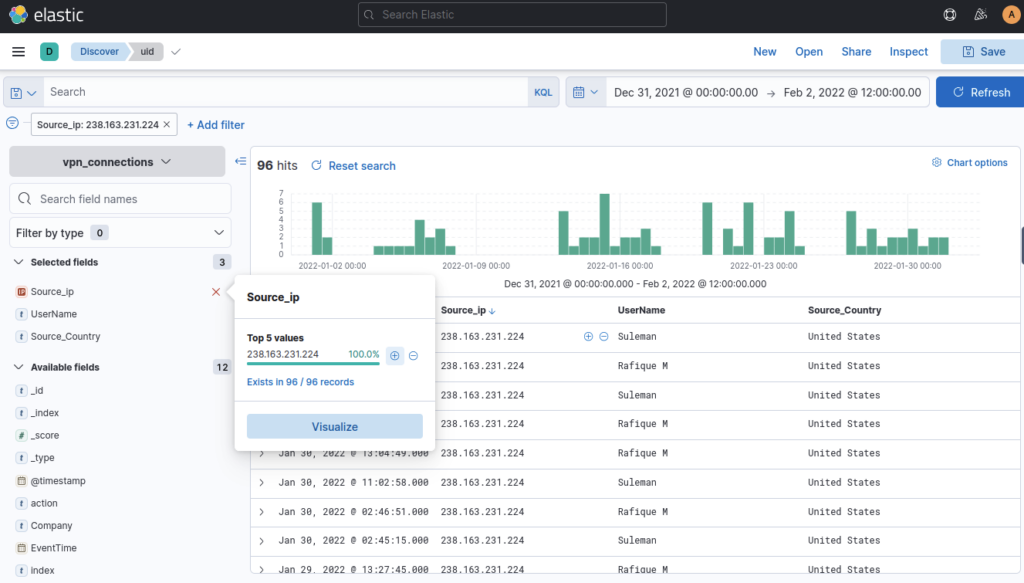
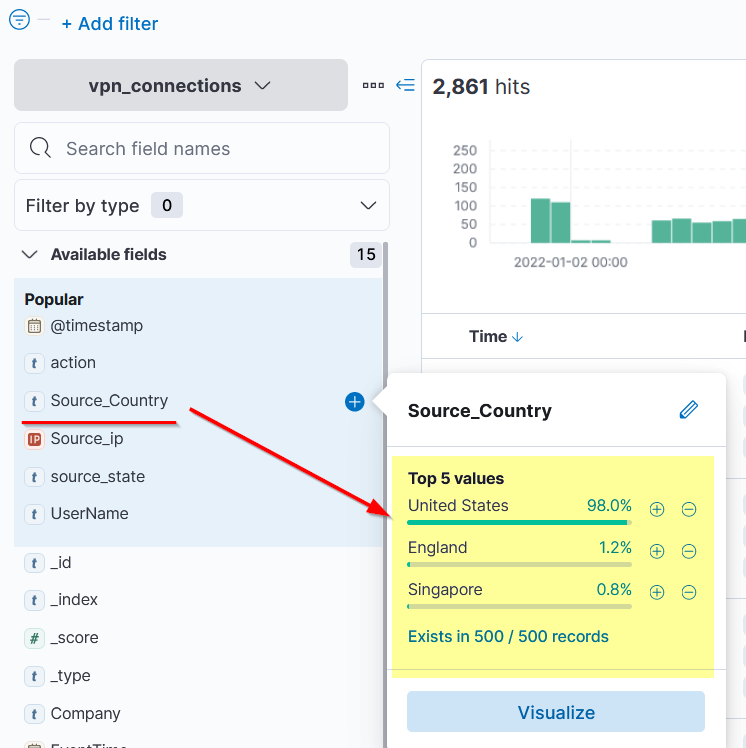
The left panel of the Kibana interface shows the list of the normalized fields it finds in the available documents/logs. Click on any field, and it will show the top 5 values and the percentage of the occurrence.
We can use these values to apply filters to them. Clicking on the + button will add a filter to show the logs containing this value, and the – button will apply the filter on this value to show the results that do not have this value.
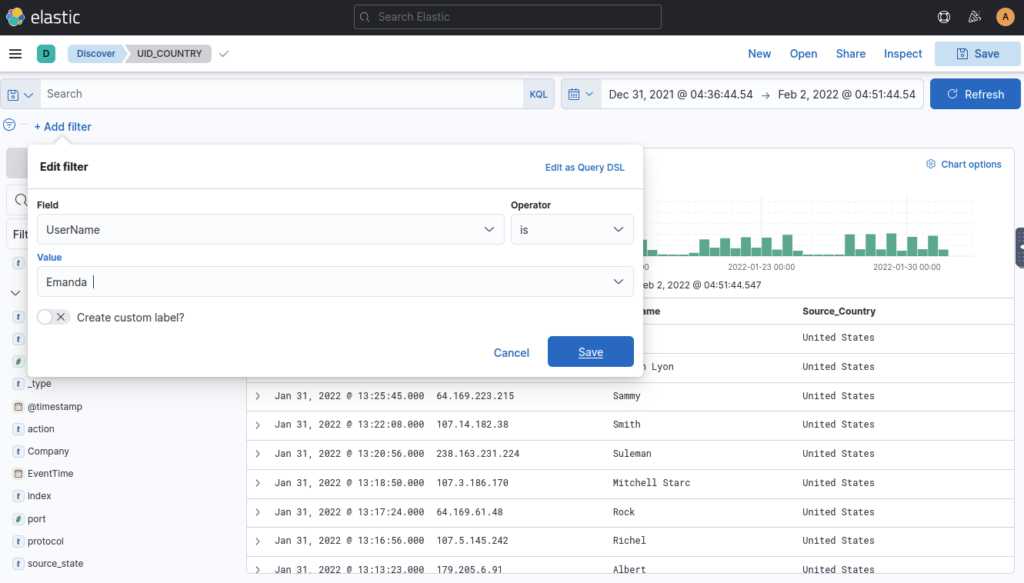
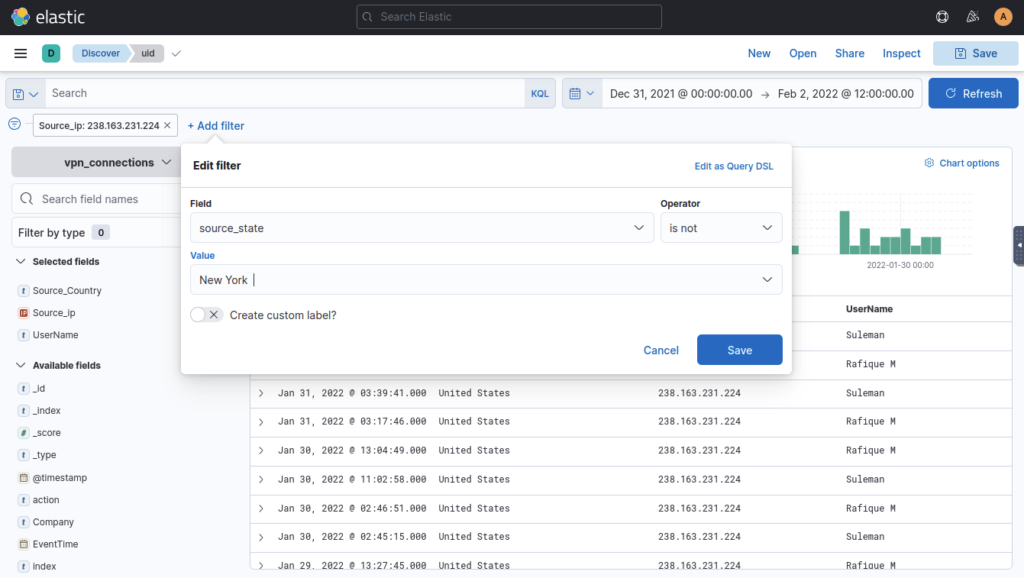
Add Filter Option
Add filter option under the search bar allows us to apply a filter on the fields as shown below.
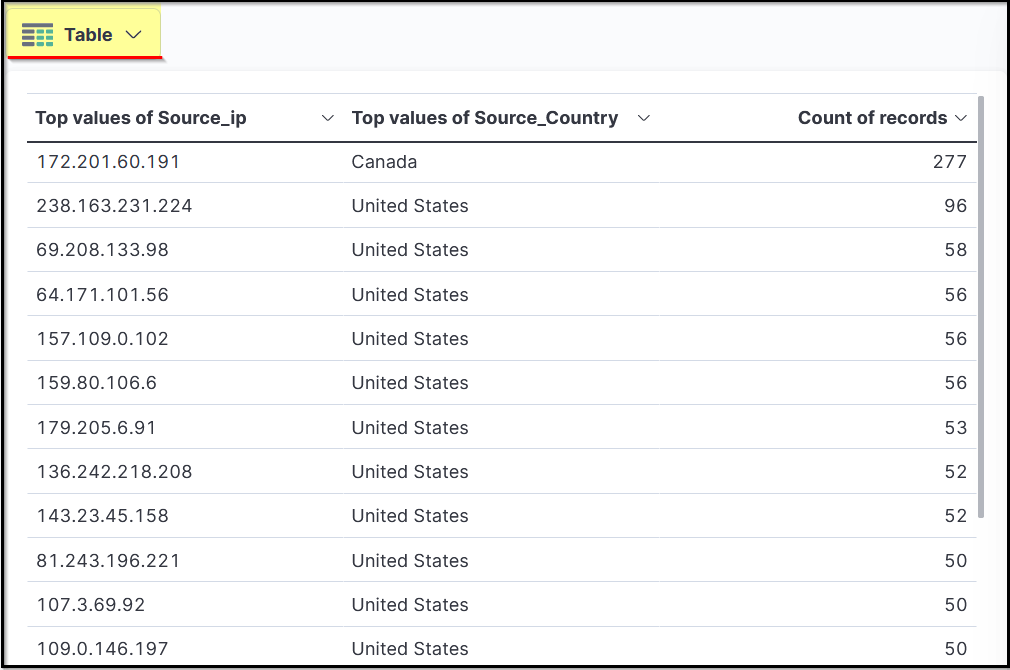
Create Table
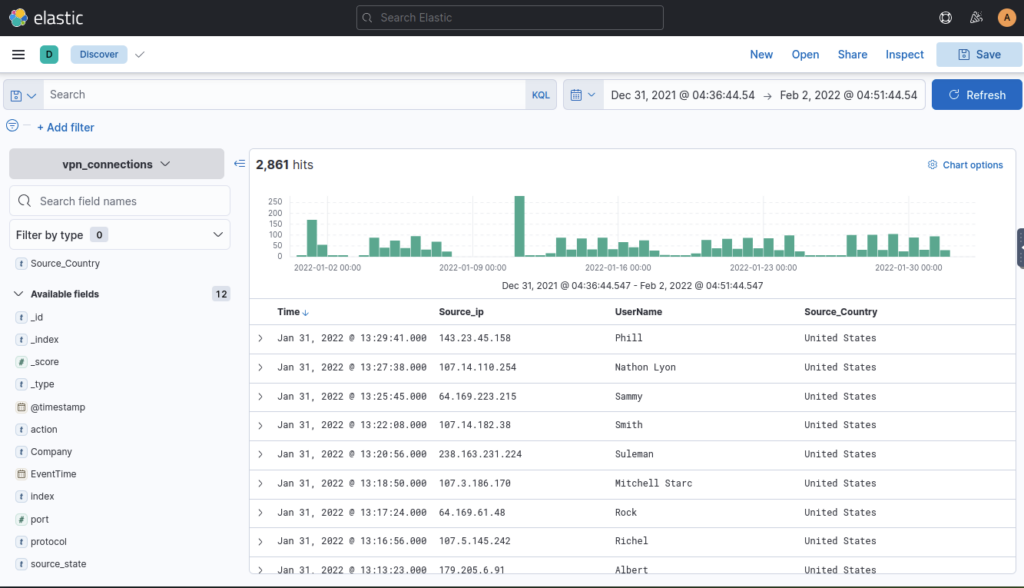
By default, the documents are shown in raw form. We can click on any document and select important fields to create a table showing only those fields. This method reduces the noise and makes it more presentable and meaningful.
Don’t forget to save the table format once it is created. It will then show the same fields every time a user logs into the dashboard.
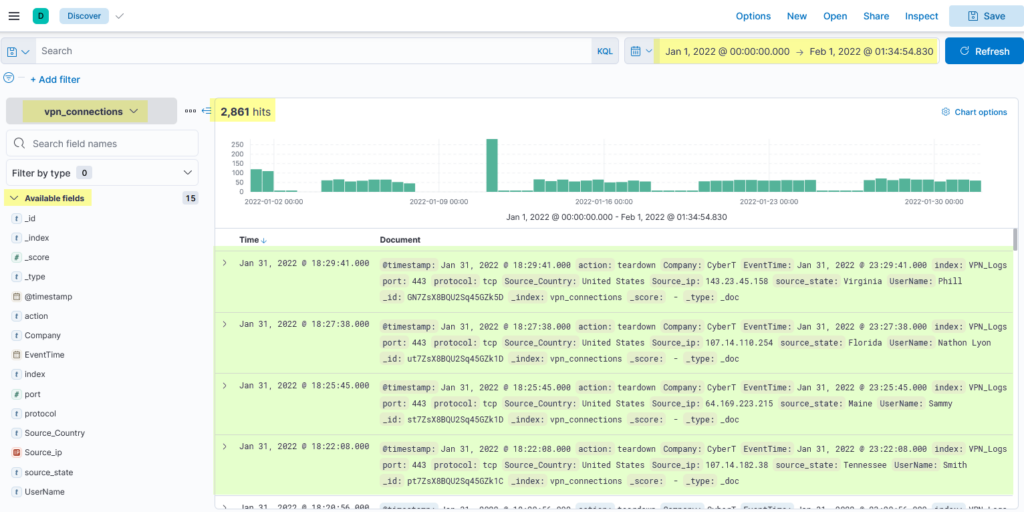
Select the index vpn_connections and filter from 31st December 2021 to 2nd Feb 2022. How many hits are returned? ANSWER: 2861
On the discover window update values in range bar, top right
Which IP address has the max number of connections? ANSWER: 238.163.231.224
Filter by Source_IP on the lefthand side
Which user is responsible for max traffic? ANSWER: JAMES
Filter by Username lefthand side
Create a table with the fields IP, UserName, Source_Country and save.
Click blue plus symbol to add field column to table, click save (top right) and give an appropriate name and brief description
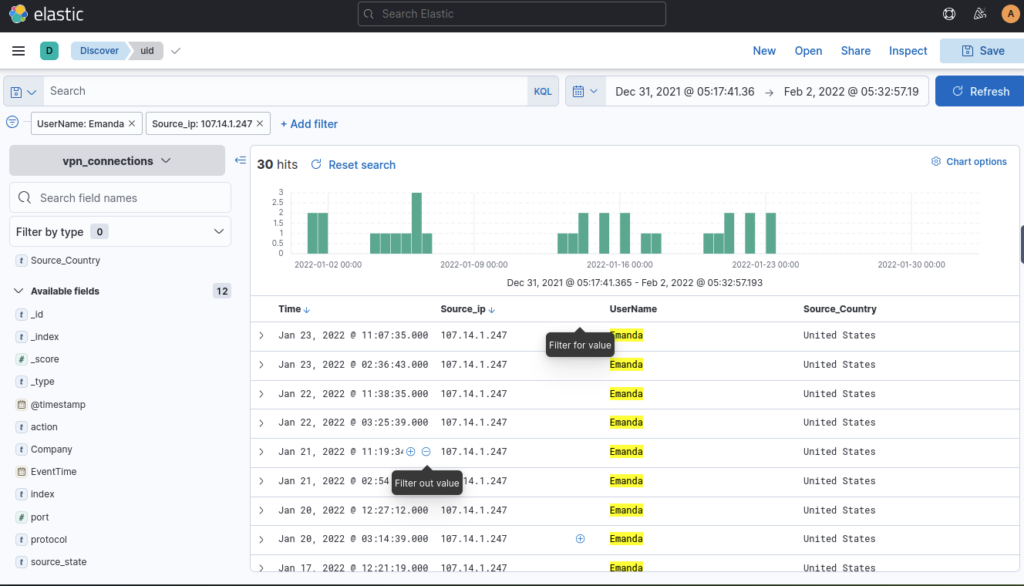
Apply Filter on UserName Emanda; which SourceIP has max hits? ANSWER: 102.14.1.247
On 11th Jan, which IP caused the spike observed in the time chart? ANSWER: 172.201.60.191
I filtered by date to find this result
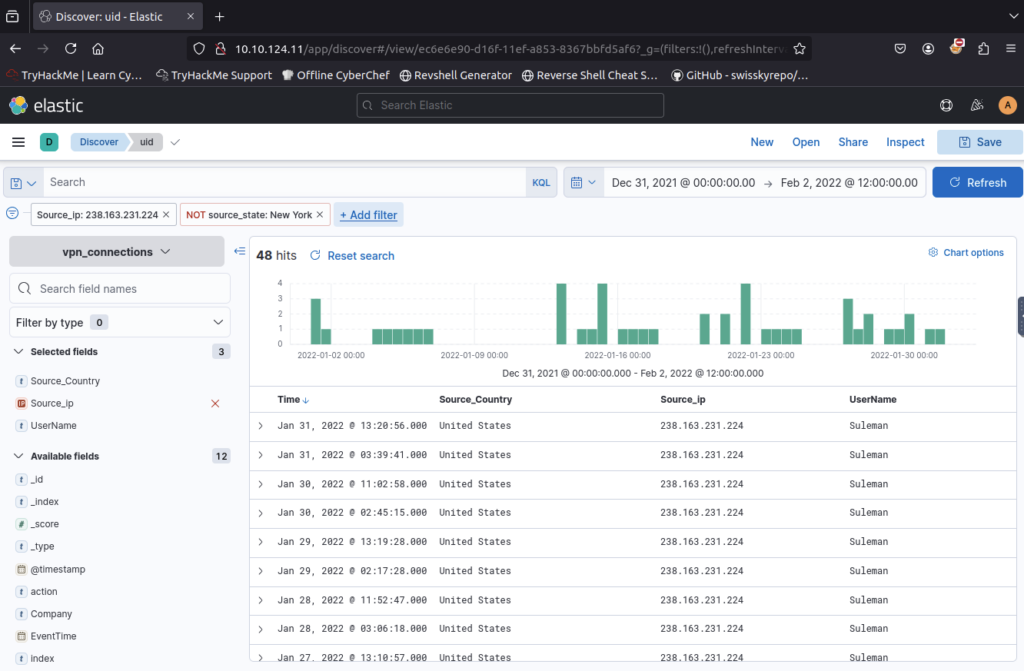
How many connections were observed from IP 238.163.231.224, excluding the New York state? ANSWER: 48
Filter by IP Address then add second filter of source_state IS NOT new york
KQL (Kibana Query Language) is a search query language used to search the ingested logs/documents in the elasticsearch. Apart from the KQL language, Kibana also supports Lucene Query Language. We can disable the KQL query as shown below.
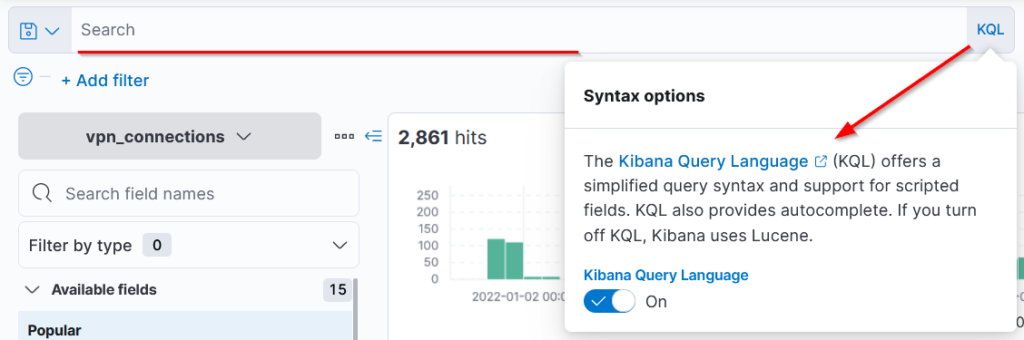
In this task, we will be exploring KQL syntax. With KQL, we can search for the logs in two different ways.
- Free text search
- Field-based search
Free text Search
Free text search allows users to search for the logs based on the text-only. That means a simple search of the term security will return all the documents that contain this term, irrespective of the field.
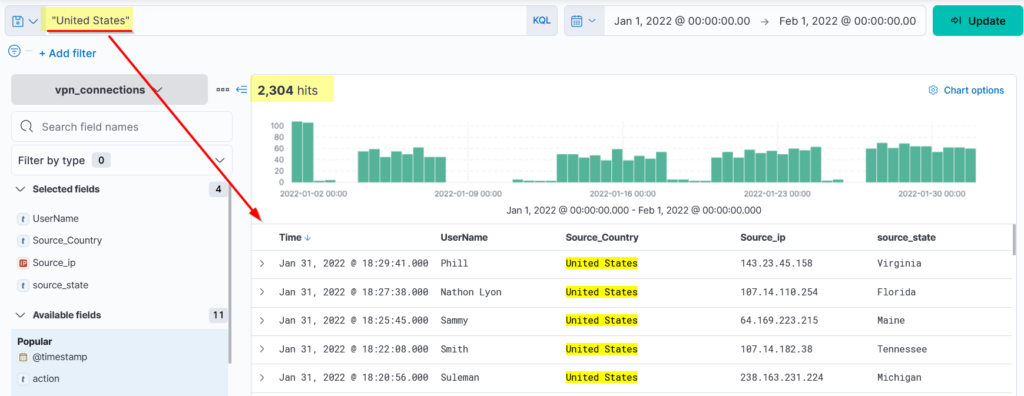
Let us look at the index, which includes the VPN logs. One of the fields Source_Country has the list of countries from where the VPN connections originated, as shown below.
Let’s search for the text United States in the search bar to return all the logs that contain this term regardless of the place or the field. This search returned 2304 hits, as shown below.
What if we only search for the term United Will it return any result?
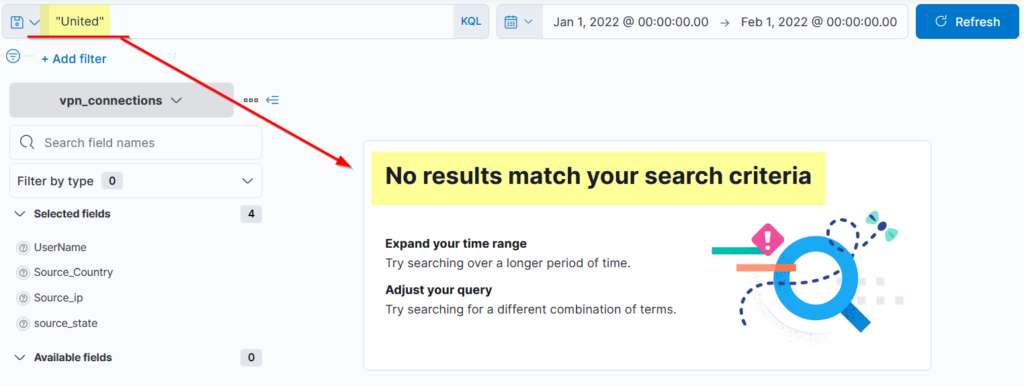
It didn’t return any result because KQL looks for the whole term/word in the documents.
WILD CARD
KQL allows the wild card * to match parts of the term/word. Let’s find out how to use this wild card in the search query.
Search Query: United*
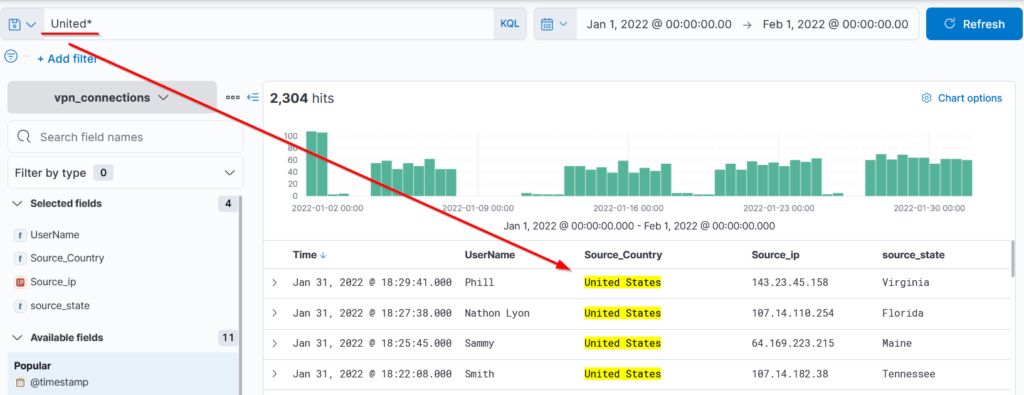
We have used the wildcard with the term United to return all the results containing the term United and any other term. If we had logs with the term United NationsIt would also have returned those as a result of this wildcard.
Logical Operators (AND | OR | NOT)
KQL also allows users to utilize the logical operators in the search query. Let us see the examples below.
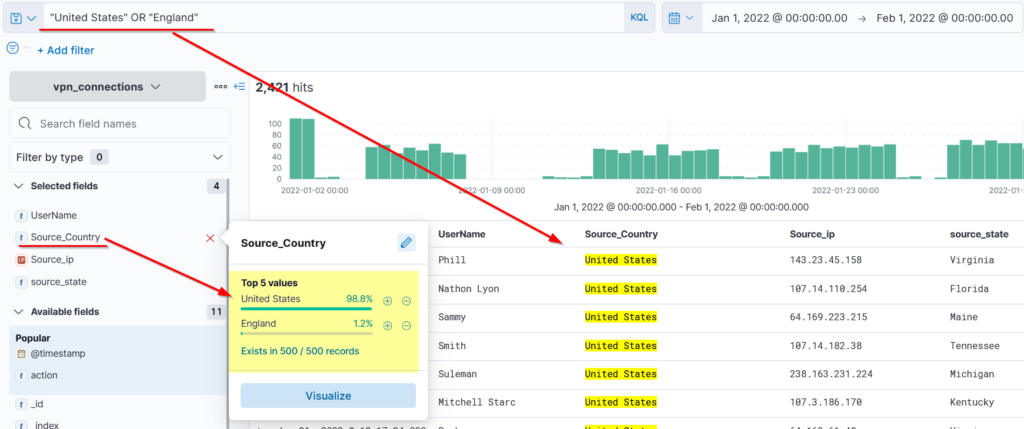
1- OR Operator
We will use the OR operator to show logs that contain either the United States or England.
Search Query: "United States" OR "England"
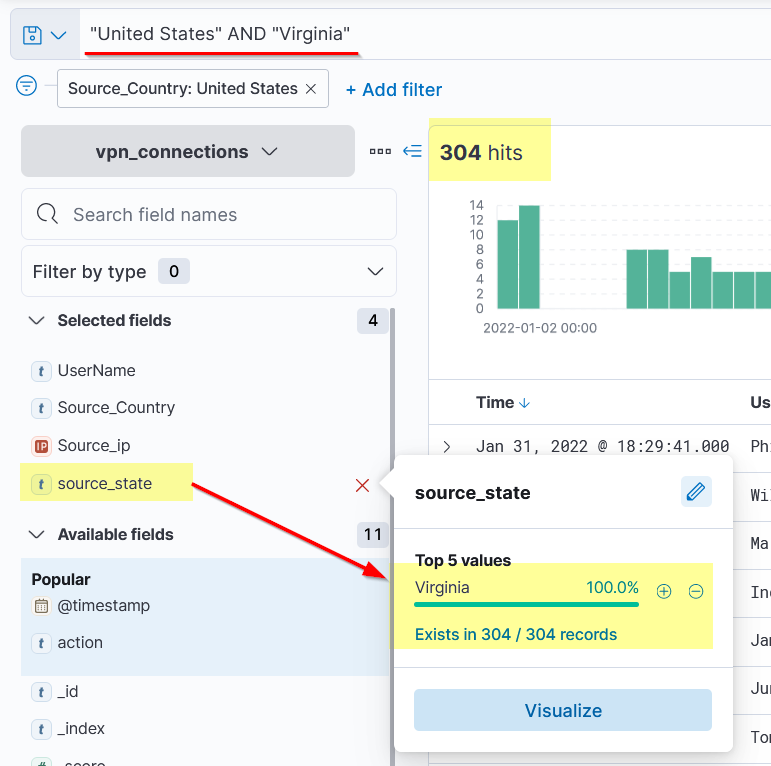
2- AND Operator
Here, we will use AND Operator to create a search that will return the logs that contain the terms “UNITED STATES” AND “Virginia.”
Search Query: "United States" AND "Virginia"
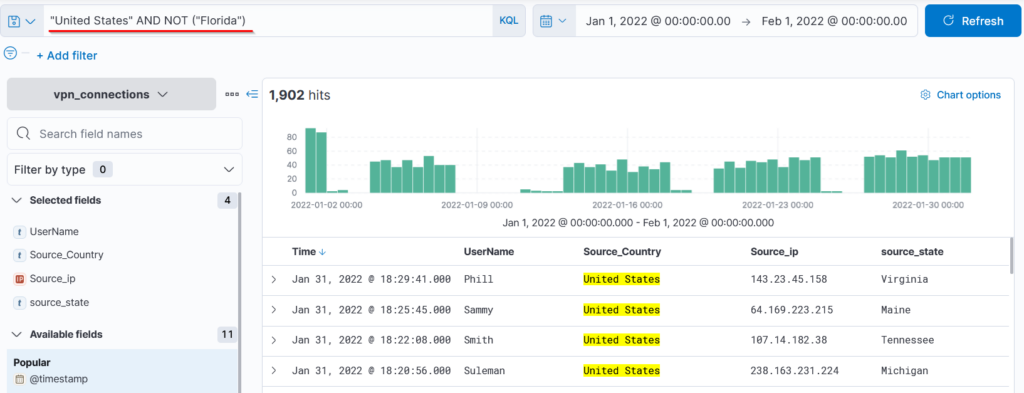
3- NOT Operator
Similarly, we can use NOT Operator to remove the particular term from the search results. This search query will show the logs from the United States, including all states but ignoring Florida.
Search Query: "United States" AND NOT ("Florida")
Field-based search
In the Field-based search, we will provide the field name and the value we are looking for in the logs. This search has a special syntax as FIELD : VALUE. It uses a colon : as a separator between the field and the value. Let’s look at a few examples.
Search Query: Source_ip : 238.163.231.224 AND UserName : Suleman
Explanation: We are telling Kibana to display all the documents in which the field Source_ip contains the value 19.112.190.54 and UserName as Suleman as shown below.
As we click on the search bar, we will be presented with all the available fields that we can use in our search query. To explore the other options of KQL, look at this official reference https://www.elastic.co/guide/en/kibana/7.17/kuery-query.html
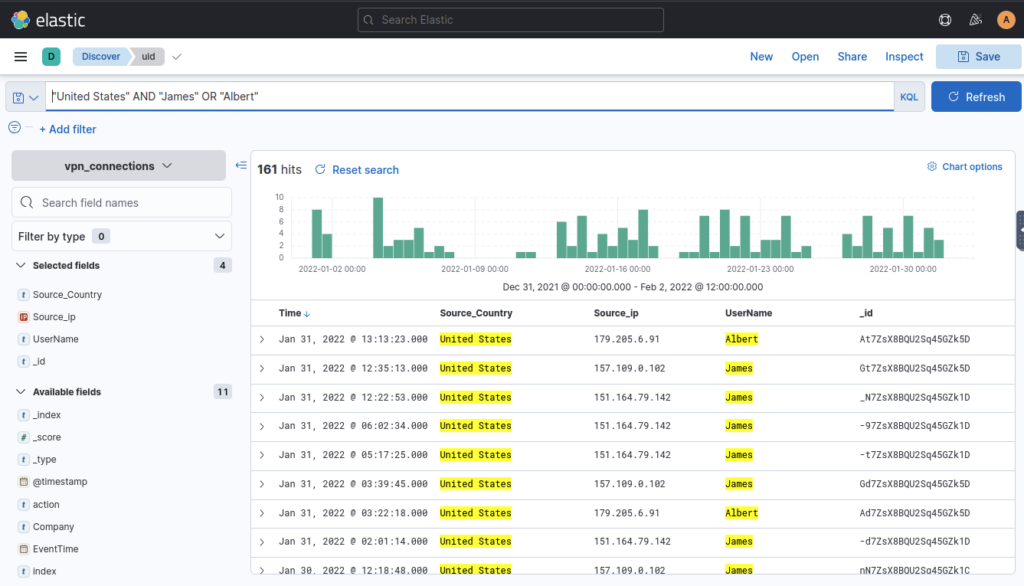
Create a search query to filter out the logs from Source_Country as the United States and show logs from User James or Albert. How many records were returned? ANSWER: 161
Using KQL search bar I typed in “United States” AND “James” OR “ALBERT”
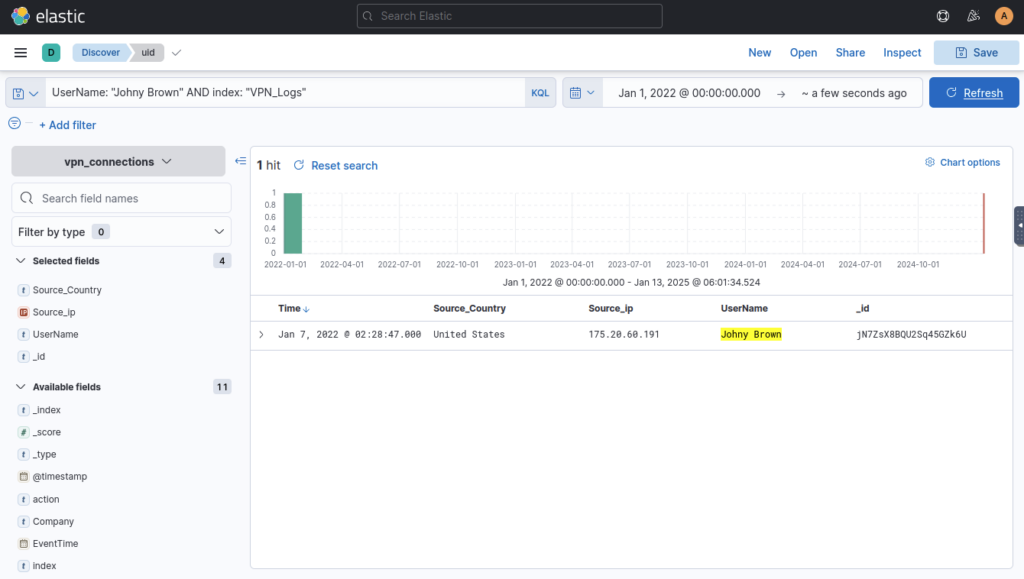
As User Johny Brown was terminated on 1st January 2022, create a search query to determine how many times a VPN connection was observed after his termination. ANSWER: 1
First update the time range to be after Jan 1

Then use KQL search bar to filter for “Johny Brown” AND “VPN_Logs” ; First time didn’t work so I added UserName and VPN_Logs to search bar but turns out I was spelling the name with two n
Creating Visualisations
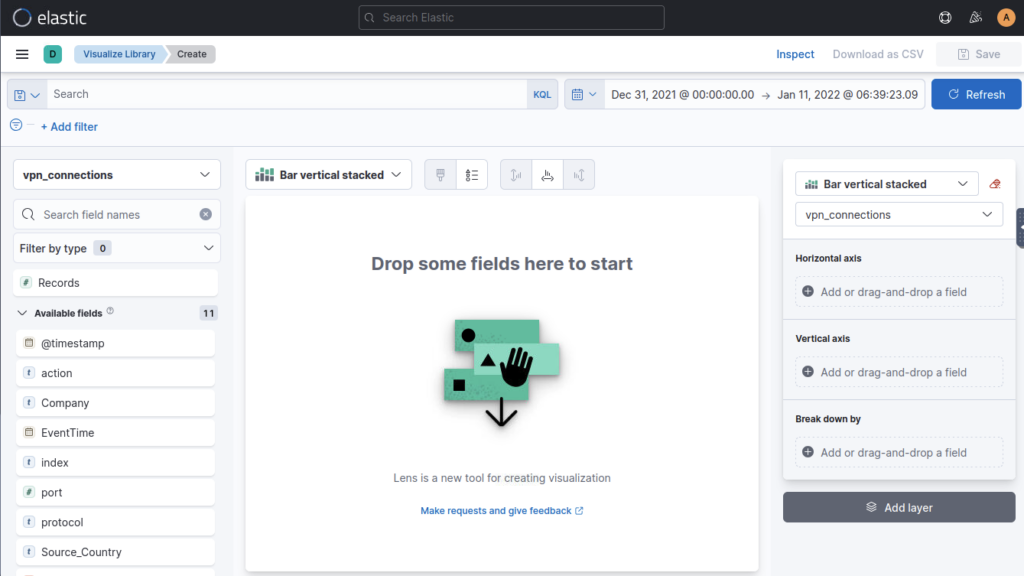
The visualization tab allows us to visualize the data in different forms like Table, Pie charts, Bar charts, etc. This visualization task will use multiple options this tab provides to create some simple presentable visualizations.
Create Visualization
There are a few ways to navigate to the visualization tab. One way is to click on any field in the discover tab and click on the visualization as shown below.
We can create multiple visualizations by selecting options like tables, pie charts, etc.
Correlation Option
Often, we require creating correlations between multiple fields. Dragging the required field in the middle will create a correlation tab in the visualization tab. Here we selected the Source_Country as the second field to show a correlation among the client Source_IP.
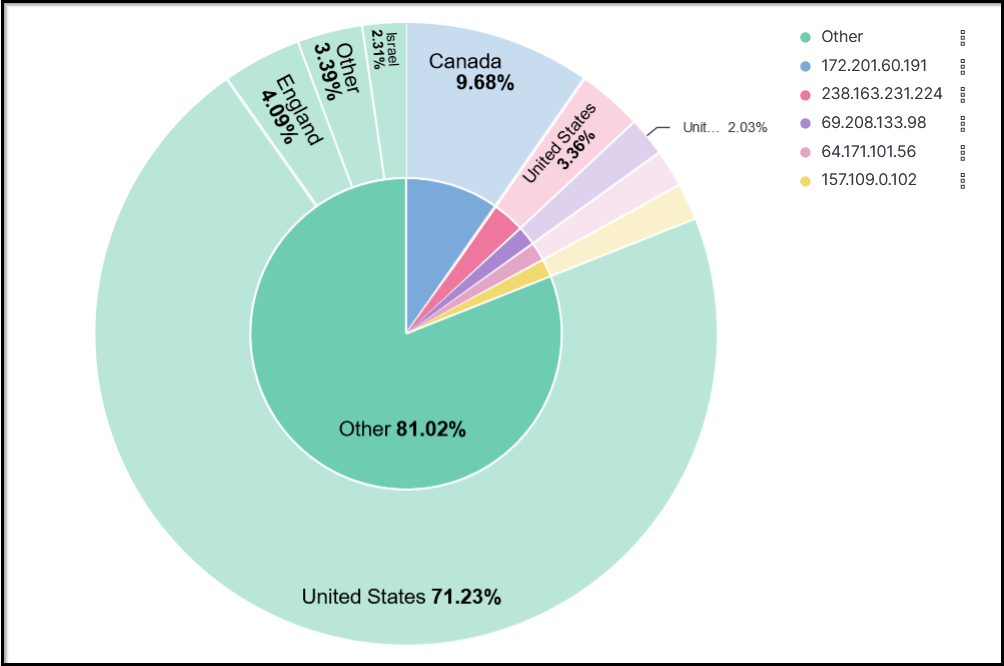
We can also create a table to show the values of the selected fields as columns, as shown below.
The most important step in creating these visualizations is to save them. Click on the save Option on the right side and fill in the descriptive values below. We can add these visualizations to the already existing dashboard, or we can create a new one as well.
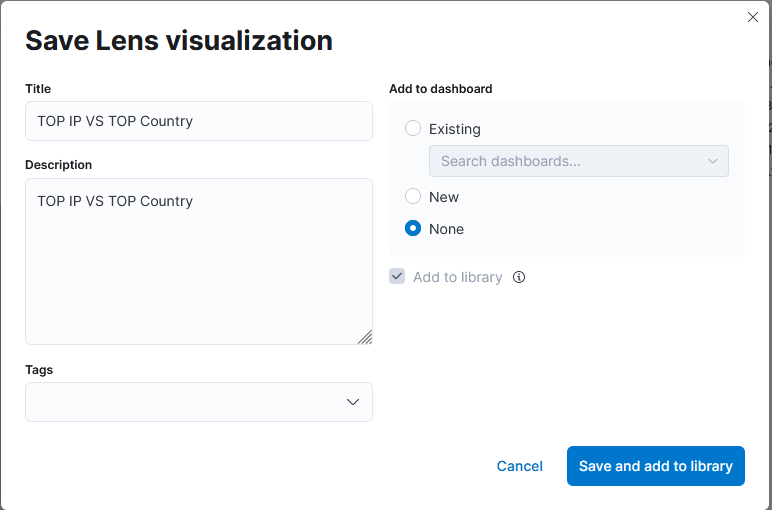
Steps to take after creating Visualizations:
- Create a visualization and Click on the Save button at the top right corner.
- Add the title and description to the visualization.
- We can add the visualization to any existing Dashboard or a new dashboard.
- Click Save and add to the library when it’s done.
Failed Connection Attempts
We will utilize the knowledge gained above to create a table to display the user and the IP address involved in failed attempts.
Which user was observed with the greatest number of failed attempts? ANSWER: Simon
Add filter of action | is | failed
But as we are in the visualisation section I best try it another way. Click on visualise library on lefthand menu (click bars top left under where it says elastic) then select lens, experiment with adding values from the left bar and exploring different options to visualise the data
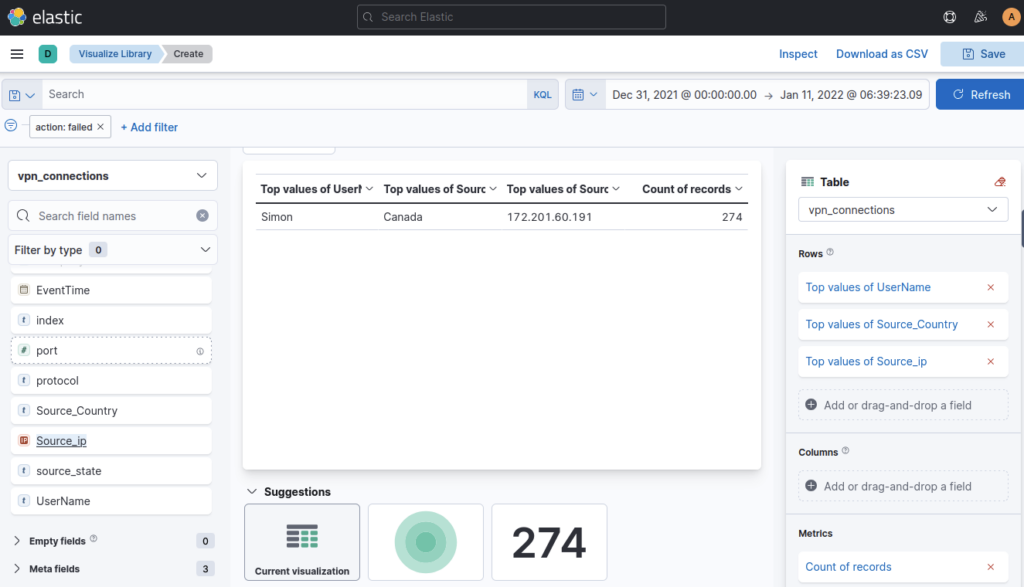
How many wrong VPN connection attempts were observed in January? ANSWER: 274
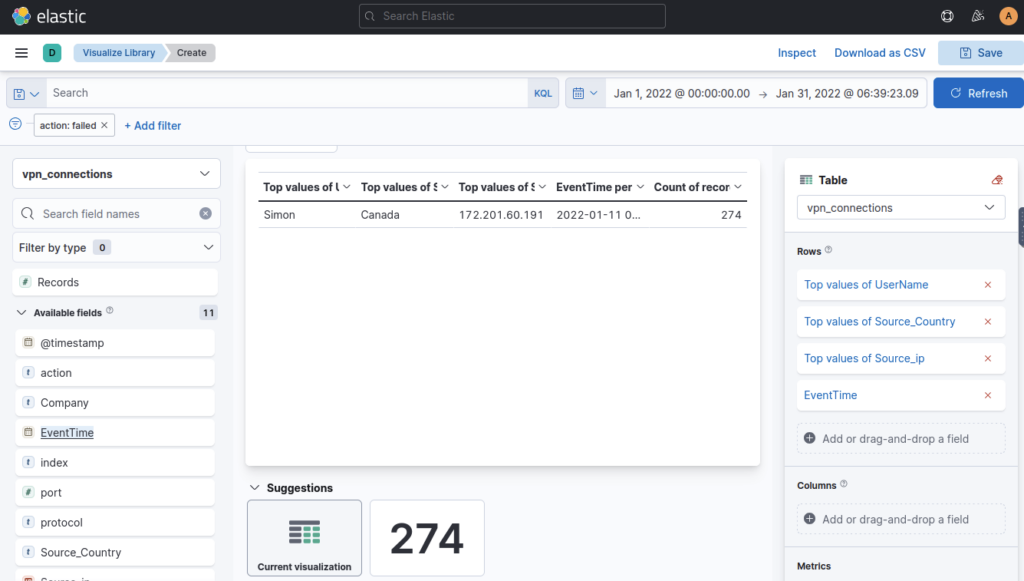
As I had my date range set wrong the answer was in front of me immediately. Whoops. Alternatively you could add event time to table and filter via that column
Creating Dashboards
Dashboards provide good visibility on the logs collection. A user can create multiple dashboards to fulfil a specific need.
In this task, we can combine different saved searches and visualizations to create a custom dashboard for VPN logs visibility.
Creating Custom Dashboard
By now, we have saved a few searches from the Discover tab and created some visualizations, and saved them. It’s time to explore the dashboard tab and create a custom dashboard. The steps to create a dashboard are:
- Go to the Dashboard tab and click on the Create dashboard.
- Click on Add from Library.
- Click on the visualizations and saved searches. It will be added to the dashboard.
- Once the items are added, adjust them accordingly, as shown below.
- Don’t forget to save the dashboard after completing it.
In this room, we briefly explored ELK components and then focused more on the Kibana interface and its features. While exploring Kibana Interface, we learned:
- How to create a search query to search for the logs
- Apply filters to narrow down the results.
- Create Visualizations and dashboards.
- How to investigate VPN logs.
This was my first TryHackMe writeup I hope you enjoyed


Leave a Reply