
This room covers an incident Handling scenario using Splunk. An incident from a security perspective is “Any event or action, that has a negative consequence on the security of a user/computer or an organization is considered a security incident.” Below are a few of the events that would negatively affect the environment when they occurred:
- Crashing the system
- Execution of an unwanted program
- Access to sensitive information from an unauthorized user
- A Website being defaced by the attacker
- The use of USB devices when there is a restriction in usage is against the company’s policy
Learning Objective

- Learn how to leverage OSINT sites during an investigation
- How to map Attacker’s activities to Cyber Kill Chain Phases
- How to utilize effective Splunk searches to investigate logs
- Understand the importance of host-centric and network-centric log sources
Room Prerequisites
Before going through this room, it is expected that the participants will have a basic understanding of Splunk. If not, consider going through this room, Splunk 101 (https://tryhackme.com/jr/splunk101).
It is good to understand the following before completing this lesson:
- Splunk overview and basic navigation
- Important Splunk Queries
- Know how to use different functions/values to craft a search query
- How to look for interesting fields
Incident Handling Life Cycle
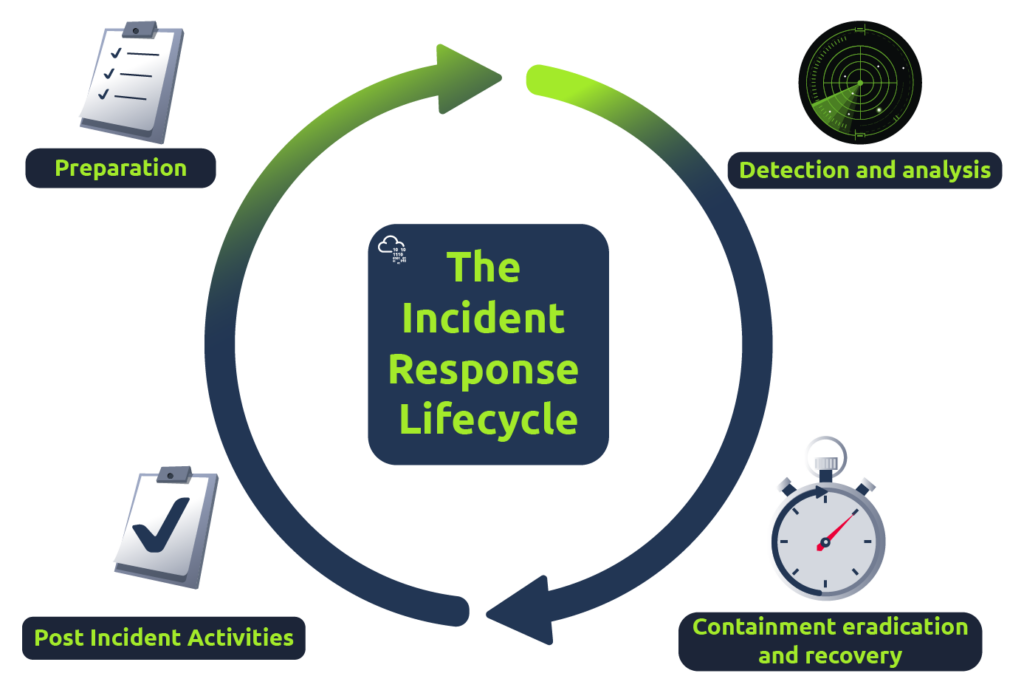
As an Incident Handler / SOC Analyst, we would aim to know the attackers’ tactics, techniques, and procedures. Then we can stop/defend/prevent against the attack in a better way. The Incident Handling process is divided into four different phases. Let’s briefly go through each phase before jumping into the incident, which we will be going through in this exercise.
1. Preparation
The preparation phase covers the readiness of an organization against an attack. That means documenting the requirements, defining the policies, incorporating the security controls to monitor like EDR / SIEM / IDS / IPS, etc. It also includes hiring/training the staff.
2. Detection and Analysis
The detection phase covers everything related to detecting an incident and the analysis process of the incident. This phase covers getting alerts from the security controls like SIEM/EDR investigating the alert to find the root cause. This phase also covers hunting for the unknown threat within the organization.
3. Containment, Eradication, and Recovery
This phase covers the actions needed to prevent the incident from spreading and securing the network. It involves steps taken to avoid an attack from spreading into the network, isolating the infected host, clearing the network from the infection traces, and gaining control back from the attack.
4. Post-Incident Activity / Lessons Learnt
This phase includes identifying the loopholes in the organization’s security posture, which led to an intrusion, and improving so that the attack does not happen next time. The steps involve identifying weaknesses that led to the attack, adding detection rules so that similar breach does not happen again, and most importantly, training the staff if required.
In this exercise, we will investigate a cyber attack in which the attacker defaced an organization’s website. This organization has Splunk as a SIEM solution setup. Our task as a Security Analysis would be to investigate this cyber attack and map the attacker’s activities into all 7 of the Cyber Kill Chain Phases. It is important to note that we don’t need to follow the sequence of the cyber kill chain during the Investigation. One finding in one phase will lead to another finding that may have mapped into some other phase.
Cyber Kill Chain
We will follow the Cyber kill Chain Model and map the attacker’s activity in each phase during this Investigation. When required, we will also utilize Open Source Intelligence (OSINT) and other findings to fill the gaps in the kill chain. It is not necessary to follow this sequence of the phases while investigating.
- Reconnaissance
- Weaponization
- Delivery
- Exploitation
- Installation
- Command & Control
- Actions on Objectives
Scenario
A Big corporate organization Wayne Enterprises has recently faced a cyber-attack where the attackers broke into their network, found their way to their web server, and have successfully defaced their website http://www.imreallynotbatman.com. Their website is now showing the trademark of the attackers with the message YOUR SITE HAS BEEN DEFACED as shown below.

They have requested “US” to join them as a Security Analyst and help them investigate this cyber attack and find the root cause and all the attackers’ activities within their network.
The good thing is, that they have Splunk already in place, so we have got all the event logs related to the attacker’s activities captured. We need to explore the records and find how the attack got into their network and what actions they performed.
This Investigation comes under the Detection and Analysis phase.
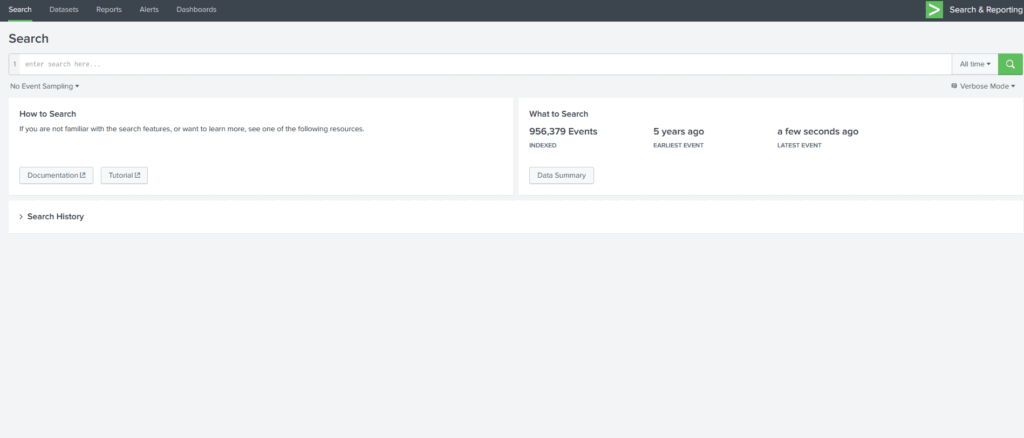
Splunk
During our investigation, we will be using Splunk as our SIEM solution. Logs are being ingested from webserver/firewall/Suricata/Sysmon etc. In the data summary tab, we can explore the log sources showing visibility into both network-centric and host-centric activities. To get the complete picture of the hosts and log sources being monitored in Wayne Enterprise, please click on the Data summary and navigate the available tabs to get the information.
Interesting log Sources
Some of the interesting log sources that will help us in our Investigation are:
| Log Sources | Details |
| wineventlog | It contains Windows Event logs |
| winRegistry | It contains the logs related to registry creation / modification / deletion etc. |
| XmlWinEventLog | It contains the sysmon event logs. It is a very important log source from an investigation point of view. |
| fortigate_utm | It contains Fortinet Firewall logs |
| iis | It contains IIS web server logs |
| Nessus:scan | It contains the results from the Nessus vulnerability scanner. |
| Suricata | It contains the details of the alerts from the Suricata IDS. This log source shows which alert was triggered and what caused the alert to get triggered— a very important log source for the Investigation. |
| stream:http | It contains the network flow related to http traffic. |
| stream: DNS | It contains the network flow related to DNS traffic. |
| stream:icmp | It contains the network flow related to icmp traffic. |
Note: All the event logs that we are going to investigate are present in index=botsv1
Now that we know what hosts we have to investigate, what sources and the source types are, let’s connect to the lab and start Investigating.
Room Machine
Before moving forward, deploy the machine. When you deploy the machine, it will be assigned an IP Machine IP: MACHINE_IP. The machine will take up to 3-5 minutes to start.
Disclaimer
As this is a public dataset released by Splunk, which depicts a realistic scenario, it is advised that this dataset may contain profanity, slang, vulgar expressions, and/or generally offensive terminology. Please use with discretion.
Wait for IP address to be visible in above description before attempting to connect
Reconnaissance Phase

Reconnaissance is an attempt to discover and collect information about a target. It could be knowledge about the system in use, the web application, employees or location, etc.
We will start our analysis by examining any reconnaissance attempt against the webserver imreallynotbatman.com. From an analyst perspective, where do we first need to look? If we look at the available log sources, we will find some log sources covering the network traffic, which means all the inbound communication towards our web server will be logged into the log source that contains the web traffic. Let’s start by searching for the domain in the search head and see which log source includes the traces of our domain.
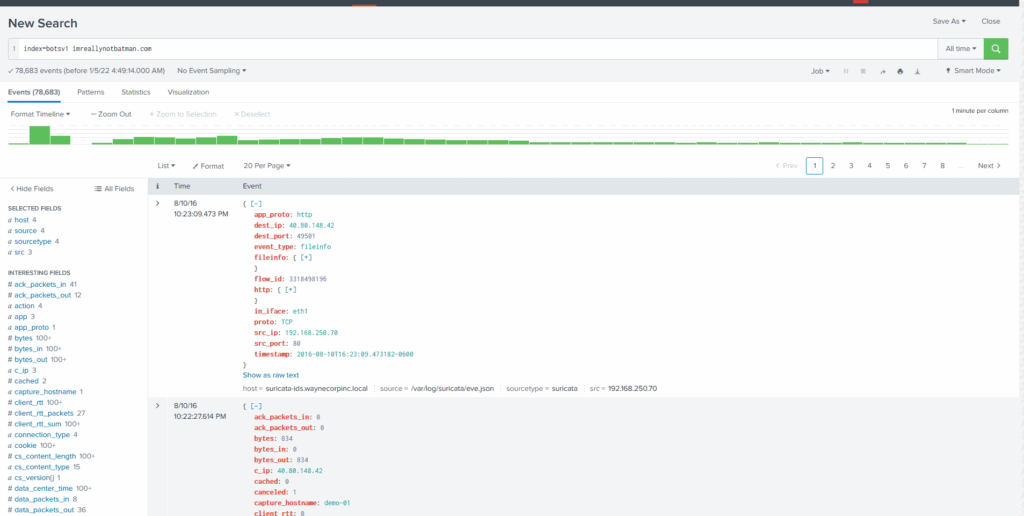
Search Query: index=botsv1 imreallynotbatman.com
Search Query explanation: We are going to look for the event logs in the index “botsv1” which contains the term imreallynotbatman.com
Here we have searched for the term imreallynotbatman.com in the index botsv1. In the sourcetype field, we saw that the following log sources contain the traces of this search term.
- Suricata
- stream:http
- fortigate_utm
- iis
From the name of these log sources, it is clear what each log source may contain. Every analyst may have a different approach to investigating a scenario. Our first task is to identify the IP address attempting to perform reconnaissance activity on our web server. It would be obvious to look at the web traffic coming into the network. We can start looking into any of the logs mentioned above sources.
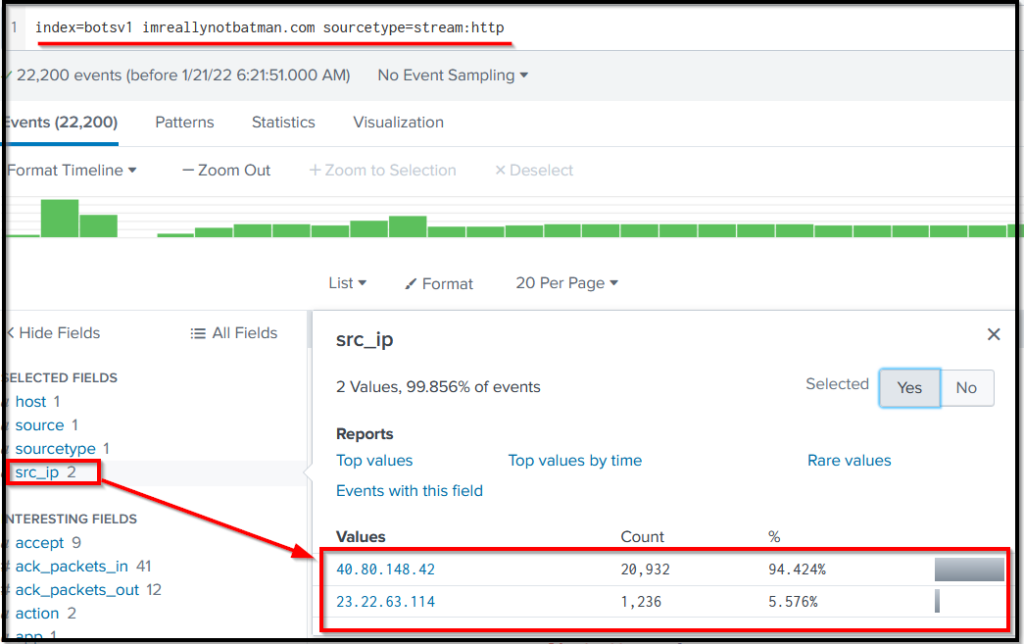
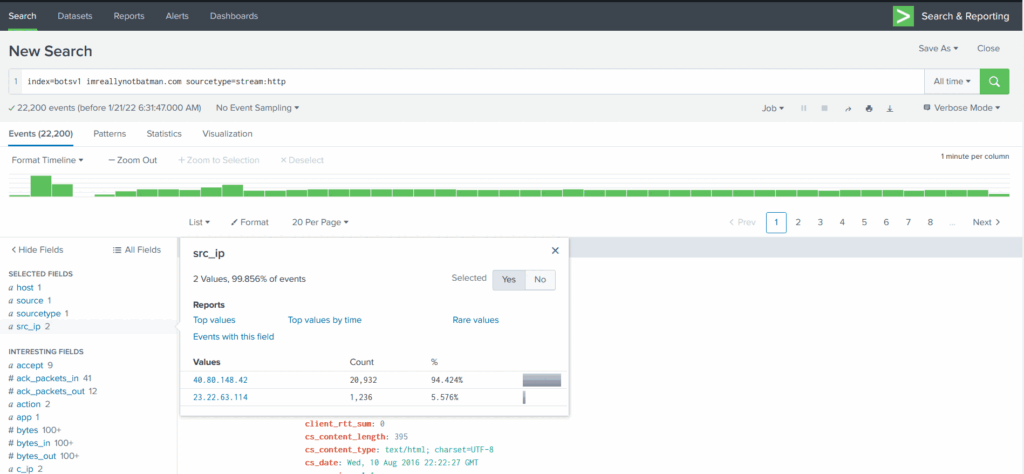
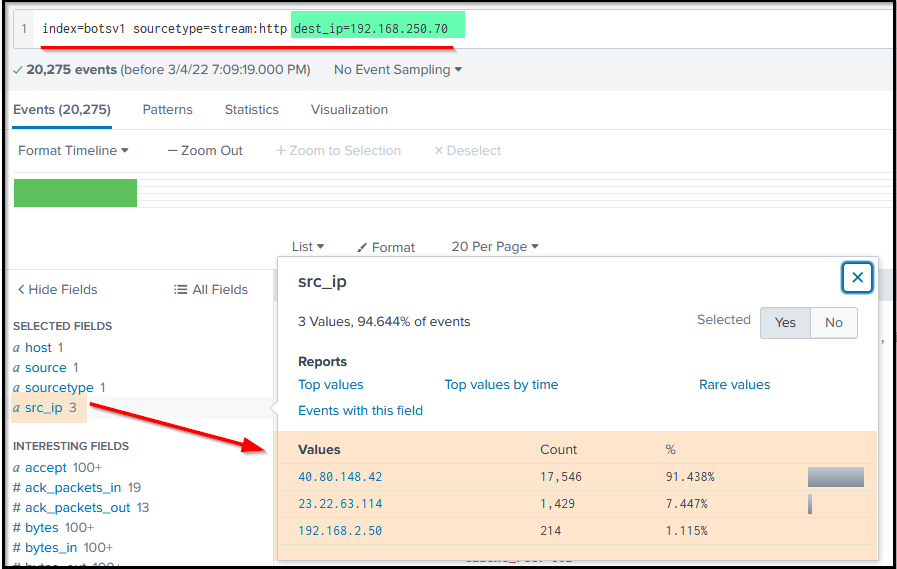
Let us begin looking at the log source stream:http, which contains the http traffic logs, and examine the src_ip field from the left panel. Src_ip field contains the source IP address it finds in the logs.
Search Query:
index=botsv1 imreallynotbatman.com sourcetype=stream:http
Search Query Explanation: This query will only look for the term imreallynotbatman.comin the stream:http log source.
Note: The important thing to note, if you don’t find the field of interest, keep scrolling in the left panel. When you click on a field, it will contain all the values it finds in the logs.
So far, we have found two IPs in the src_ip field 40.80.148.42 and 23.22.63.114. The first IP seems to contain a high percentage of the logs as compared to the other IP, which could be the answer. If you want to confirm further, click on each IP one by one, it will be added into the search query, and look at the logs, and you will find the answer.
To further confirm our suspicion about the IP address 40.80.148.42, click on the IP and examine the logs. We can look at the interesting fields like User-Agent, Post request, URIs, etc., to see what kind of traffic is coming from this particular IP.
We have narrowed down the results to only show the logs from the source IP 40.80.148.42, looked at the fields of interest and found the traces of the domain being probed.
Validate the IP that is scanningSo what do we need to do to validate the scanning attempt? Simple, dig further into the weblogs. Let us narrow down the result, look into the suricata logs, and see if any rule is triggered on this communication.
Search Query: index=botsv1 imreallynotbatman.com src=40.80.148.42 sourcetype=suricata
Search Query Explanation: This query will show the logs from the suricata log source that are detected/generated from the source IP 40.80.248.42
We have narrowed our search on the src IP and looked at the source type suricata to see what Suricata triggered alerts. In the right panel, we could not find the field of our interest, so we clicked on more fields and searched for the fields that contained the signature alerts information, which is an important point to note.
One suricata alert highlighted the CVE value associated with the attack attempt. What is the CVE value?
Answer: CVE-2014-6271
What is the CMS our web server is using?
Answer: joomla
What is the web scanner, the attacker used to perform the scanning attempts?
Answer: acunetix
What is the IP address of the server imreallynotbatman.com?
Answer: 192.168.250.70
Exploitation Phase
The attacker needs to exploit the vulnerability to gain access to the system/server.
In this task, we will look at the potential exploitation attempt from the attacker against our web server and see if the attacker got successful in exploiting or not.
To begin our investigation, let’s note the information we have so far:
- We found two IP addresses from the reconnaissance phase with sending requests to our server.
- One of the IPs
40.80.148.42was seen attempting to scan the server with IP 192.168.250.70. - The attacker was using the web scanner Acunetix for the scanning attempt.
Count
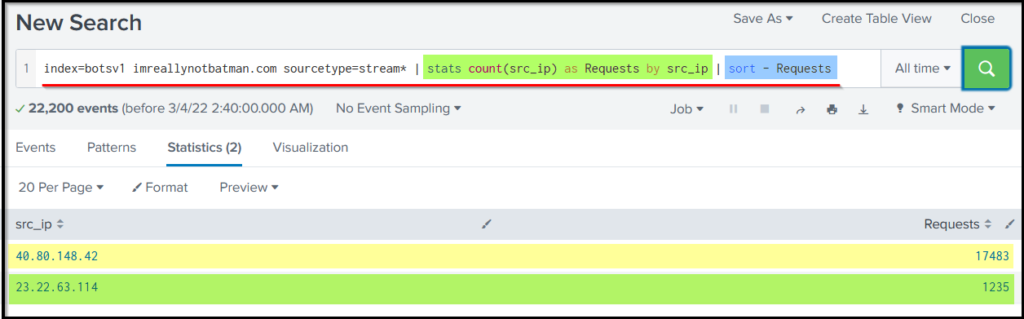
Let’s use the following search query to see the number of counts by each source IP against the webserver.
Search Query:index=botsv1 imreallynotbatman.com sourcetype=stream* | stats count(src_ip) as Requests by src_ip | sort - Requests
Query Explanation: This query uses the stats function to display the count of the IP addresses in the field src_ip.
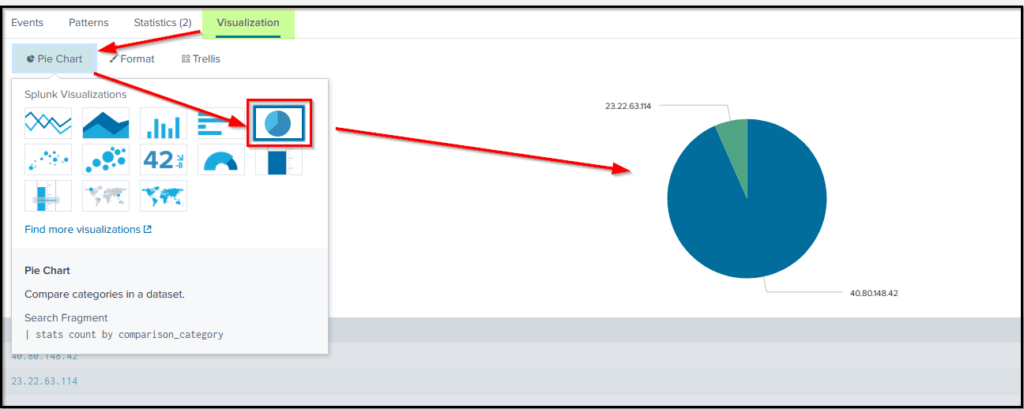
Additionally, we can also create different visualization to show the result. Click on Visualization → Select Visualization as shown below.
Now we will narrow down the result to show requests sent to our web server, which has the IP 192.168.250.70
Search Query: index=botsv1 sourcetype=stream:http dest_ip="192.168.250.70"
Query Explanation: This query will look for all the inbound traffic towards IP 192.168.250.70.
The result in the src_ip field shows three IP addresses (1 local IP and two remote IPs) that originated the HTTP traffic towards our webserver.
Another interesting field, http_method will give us information about the HTTP Methods observed during these HTTP communications.
We observed most of the requests coming to our server through the POST request, as shown below.
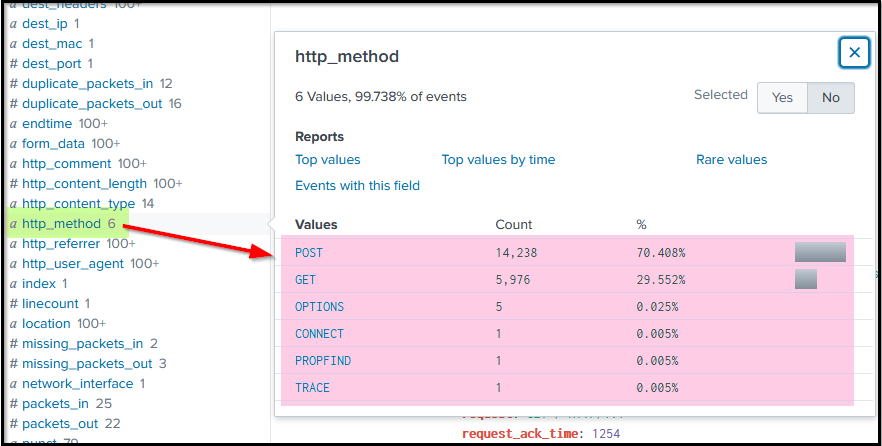
To see what kind of traffic is coming through the POST requests, we will narrow down on the field
http_method=POST
as shown below:
Search Query: index=botsv1 sourcetype=stream:http dest_ip="192.168.250.70" http_method=POST
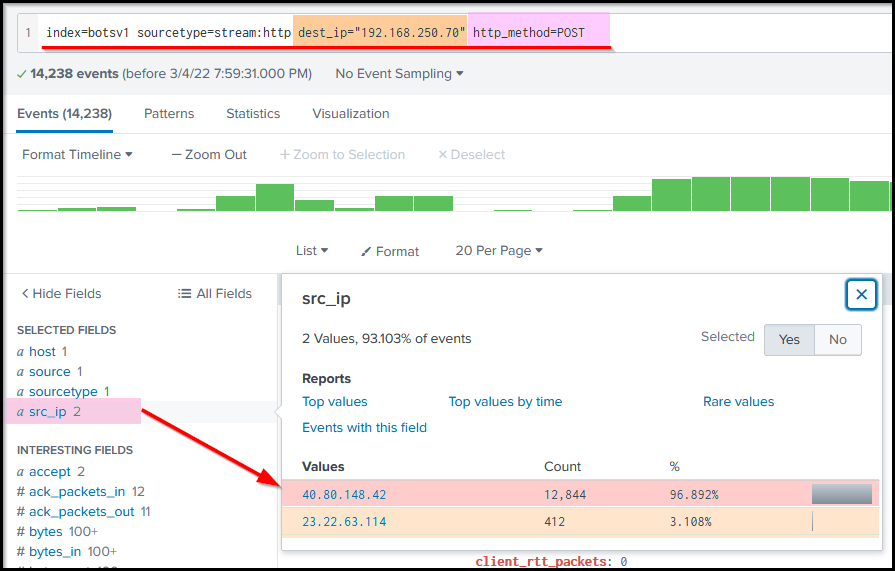
The result in the src_ip field shows two IP addresses sending all the POST requests to our server.
Interesting fields: In the left panel, we can find some interesting fields containing valuable information. Some of the fields are:
- src_ip
- form_data
- http_user_agent
- uri

The term Joomla is associated with the webserver found in a couple of fields like uri, uri_path, http_referrer, etc. This means our webserver is using Joomla CMS (Content Management Service) in the backend.
A little search on the internet for the admin login page of the Joomla CMS will show as -> /joomla/administrator/index.php
It is important because this uri contains the login page to access the web portal therefore we will be examining the traffic coming into this admin panel for a potential brute-force attack.
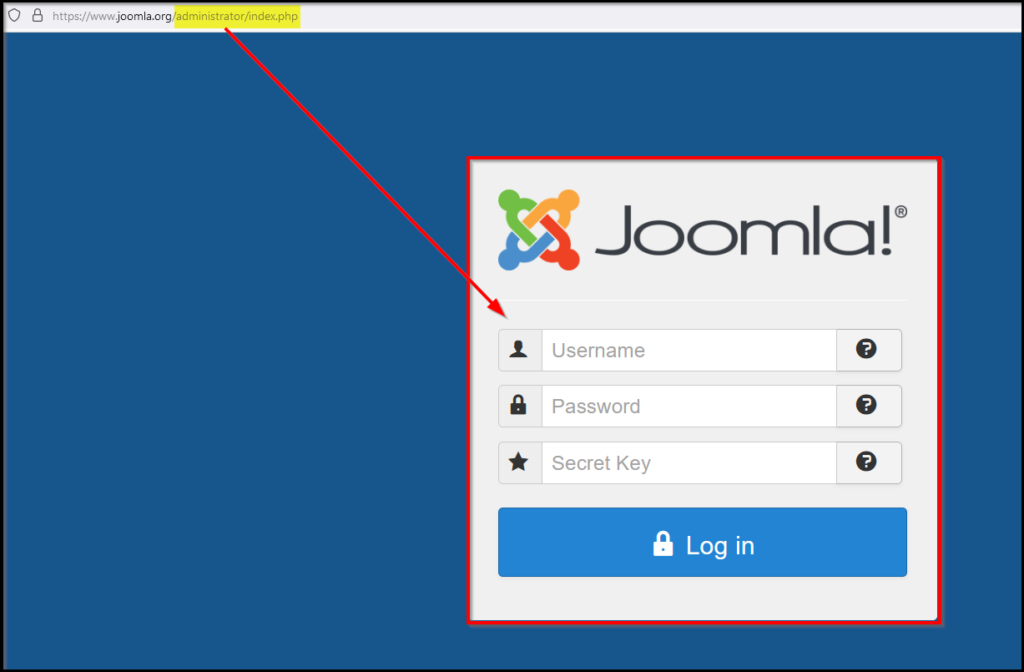
Reference: https://www.joomla.org/administrator/index.php
We can narrow down our search to see the requests sent to the login portal using this information.
Search query: index=botsv1 imreallynotbatman.com sourcetype=stream:http dest_ip="192.168.250.70" uri="/joomla/administrator/index.php"
Query Explanation: We are going to add uri="/joomla/administrator/index.php" in the search query to show the traffic coming into this URI.
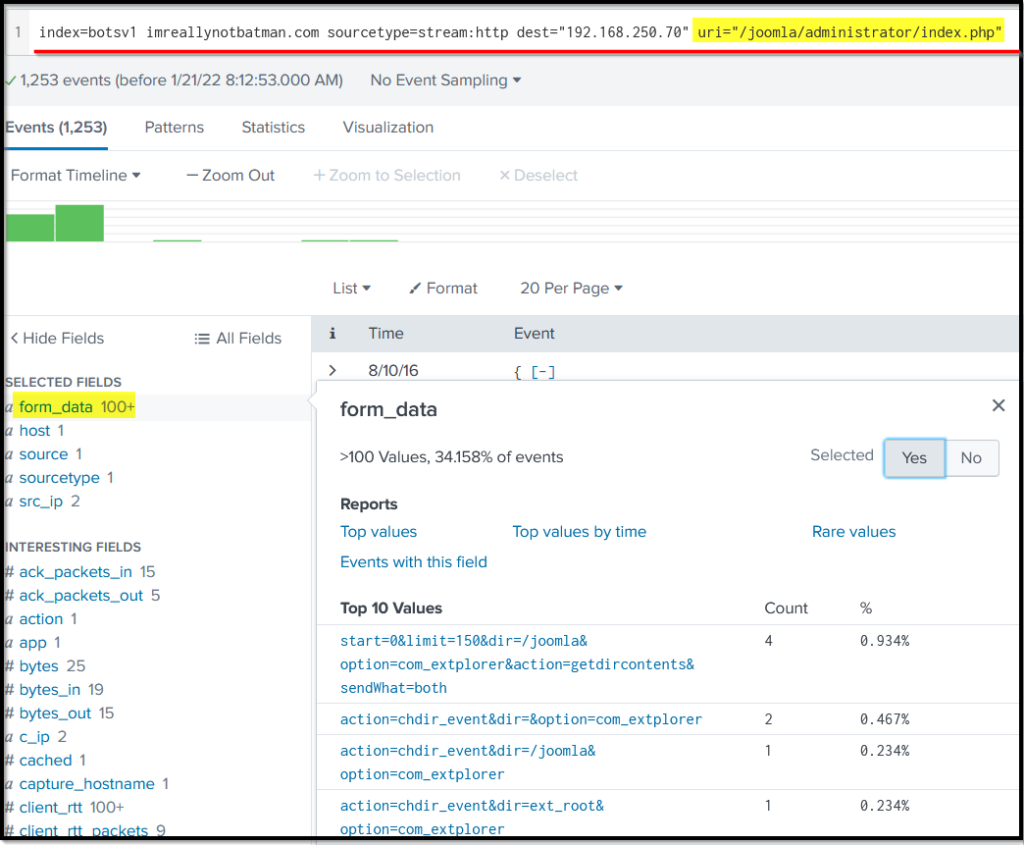
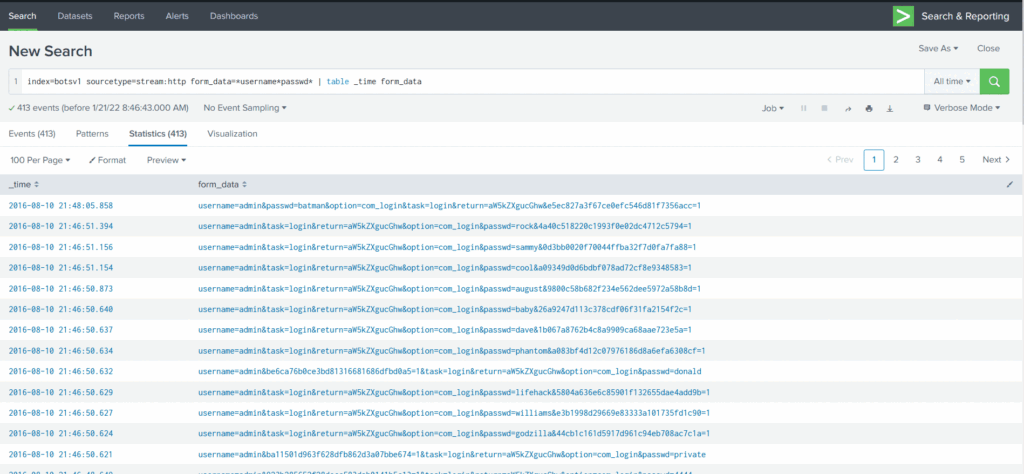
form_data The field contains the requests sent through the form on the admin panel page, which has a login page. We suspect the attacker may have tried multiple credentials in an attempt to gain access to the admin panel. To confirm, we will dig deep into the values contained within the form_data field, as shown below:
Search Query: index=botsv1 sourcetype=stream:http dest_ip="192.168.250.70" http_method=POST uri="/joomla/administrator/index.php" | table _time uri src_ip dest_ip form_data
Query Explanation: We will add this -> | table _time uri src_ip dest_ip form_data to create a table containing important fields as shown below:
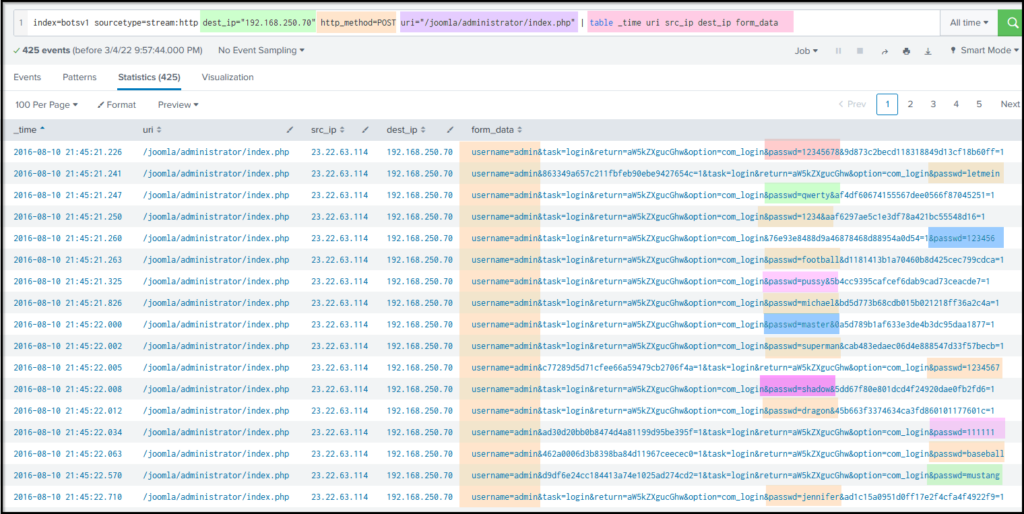
If we keep looking at the results, we will find two interesting fields username that includes the single username admin in all the events and another field passwd that contains multiple passwords in it, which shows the attacker from the IP 23.22.63.114 Was trying to guess the password by brute-forcing and attempting numerous passwords.
The time elapsed between multiple events also suggests that the attacker was using an automated tool as various attempts were observed in a short time.
Extracting Username and Passwd Fields using Regex
Looking into the logs, we see that these fields are not parsed properly. Let us use Regex in the search to extract only these two fields and their values from the logs and display them.
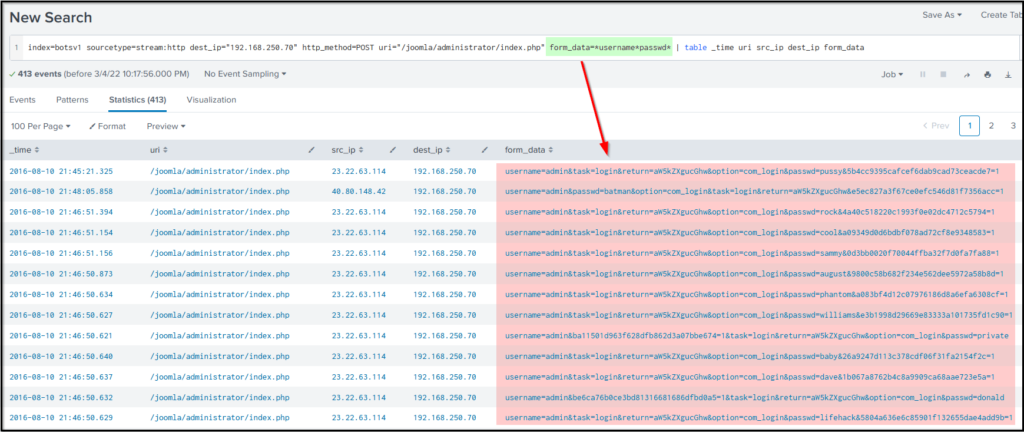
We can display only the logs that contain the username and passwd values in the form_data field by adding form_data=*username*passwd* in the above search.
Search Query:
index=botsv1 sourcetype=stream:http dest_ip="192.168.250.70" http_method=POST uri="/joomla/administrator/index.php" form_data=*username*passwd* | table _time uri src_ip dest_ip form_data
It’s time to use Regex (regular expressions) to extract all the password values found against the field passwd in the logs. To do so, Splunk has a function called rex. If we type it in the search head, it will show detail and an example of how to use it to extract the values.
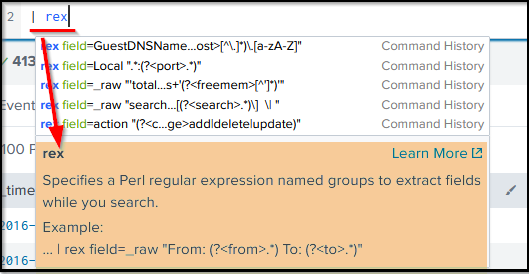
Now, let’s use Regex.
rex field=form_data "passwd=(?<creds>w+)"
To extract the
passwd
values only. This will pick the
form_data
field and extract all the values found with the field.
creds
.
Search Query:index=botsv1 sourcetype=stream:http dest_ip="192.168.250.70" http_method=POST form_data=*username*passwd* | rex field=form_data "passwd=(?<creds>w+)" | table src_ip creds
We have extracted the passwords being used against the username admin on the admin panel of the webserver. If we examine the fields in the logs, we will find two values against the field http_user_agent as shown below:
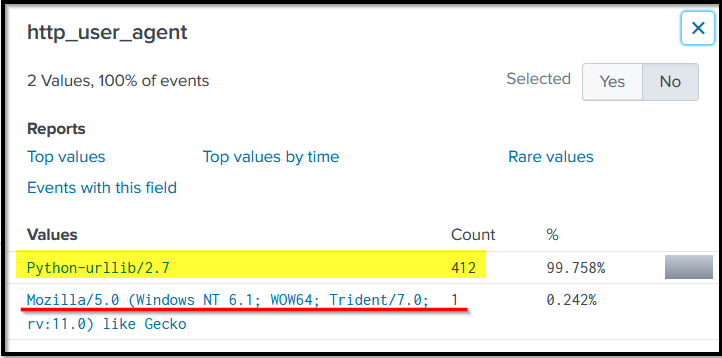
The first value clearly shows attacker used a python script to automate the brute force attack against our server. But one request came from a Mozilla browser. WHY? To find the answer to this query, let’s slightly change to the about search query and add http_user_agent a field in the search head.
Let’s create a table to display key fields and values by appending -> | table _time src_ip uri http_user_agent creds in the search query as shown below.
Search Query: index=botsv1 sourcetype=stream:http dest_ip="192.168.250.70" http_method=POST form_data=*username*passwd* | rex field=form_data "passwd=(?<creds>w+)" |table _time src_ip uri http_user_agent creds
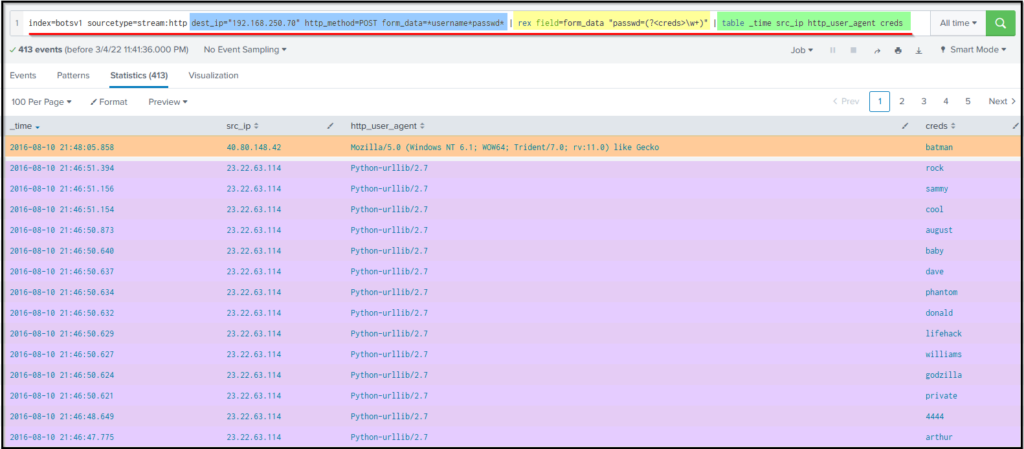
This result clearly shows a continuous brute-force attack attempt from an IP 23.22.63.114 and 1 password attempt batman from IP 40.80.148.42 using the Mozilla browser.
What was the URI which got multiple brute force attempts?
Answer: /joomla/administrator/index.php
Against which username was the brute force attempt made?
Answer: admin
What was the correct password for admin access to the content management system running imreallynotbatman.com?
Answer: batman
How many unique passwords were attempted in the brute force attempt?
Answer: 412
What IP address is likely attempting a brute force password attack against imreallynotbatman.com?
Answer: 23.22.63.114
After finding the correct password, which IP did the attacker use to log in to the admin panel?
Answer: 40.80.148.142
Installation Phase

Once the attacker has successfully exploited the security of a system, he will try to install a backdoor or an application for persistence or to gain more control of the system. This activity comes under the installation phase.
In the previous Exploitation phase, we found evidence of the webserver iamreallynotbatman.com getting compromised via brute-force attack by the attacker using the python script to automate getting the correct password. The attacker used the IP” for the attack and the IP to log in to the server. This phase will investigate any payload / malicious program uploaded to the server from any attacker’s IPs and installed into the compromised server.
To begin an investigation, we first would narrow down any http traffic coming into our server 192.168.250.70 containing the term “.exe.” This query may not lead to the findings, but it’s good to start from 1 extension and move ahead.
Search Query: index=botsv1 sourcetype=stream:http dest_ip="192.168.250.70" *.exe
With the search query in place, we are looking for the fields that could have some values of our interest. As we could not find the file name field, we looked at the missing fields and saw a field. part_filename{}.
Observing the interesting fields and values, we can see the field part_filename{} contains the two file names. an executable file 3791.exe and a PHP file agent.php
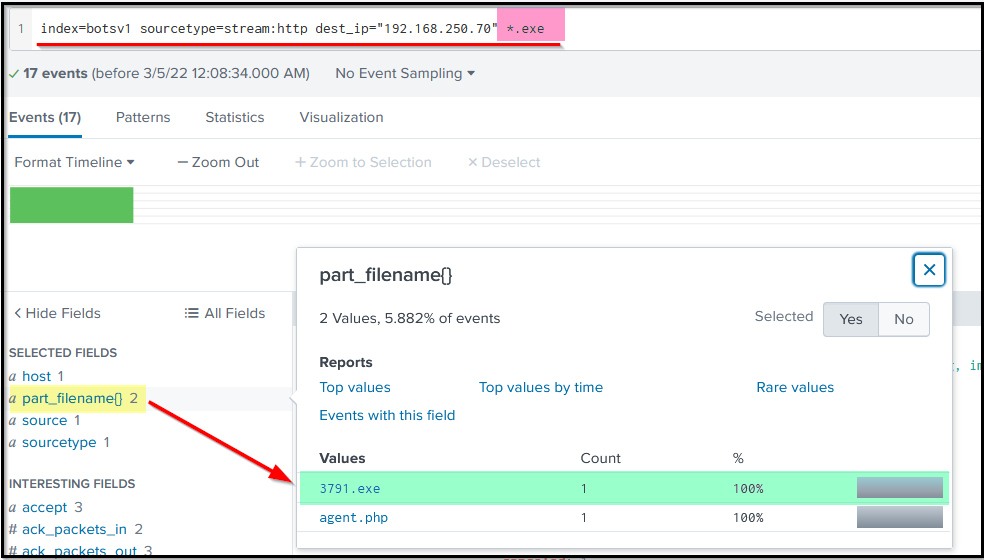
Next, we need to find if any of these files came from the IP addresses that were found to be associated with the attack earlier.
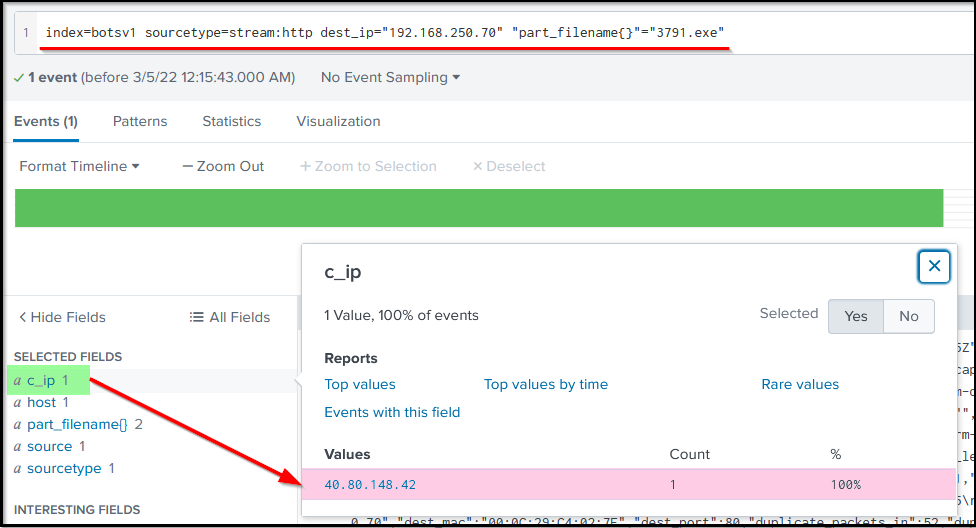
Click on the file name; it will be added to the search query, then look for the field c_ip, which seems to represent the client IP.
Search Query:index=botsv1 sourcetype=stream:http dest_ip="192.168.250.70" "part_filename{}"="3791.exe"
Was this file executed on the server after being uploaded?
We have found that file 3791.exe was uploaded on the server. The question that may come to our mind would be, was this file executed on the server? We need to narrow down our search query to show the logs from the host-centric log sources to answer this question.
Search Query: index=botsv1 "3791.exe"
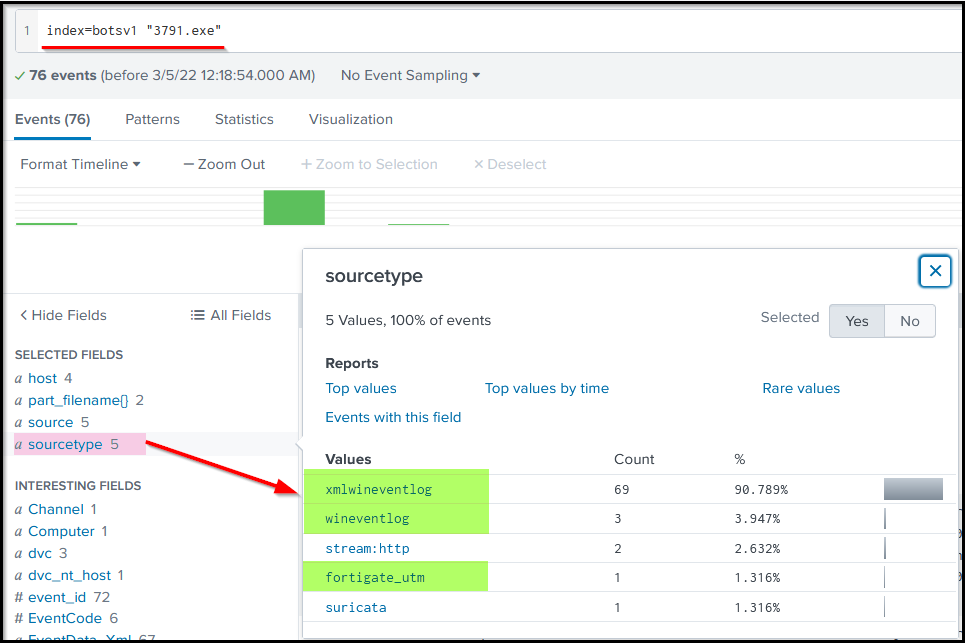
Following the Host-centric log, sources were found to have traces of the executable 3791. exe.
- Sysmon
- WinEventlog
- fortigate_utm
For the evidence of execution, we can leverage sysmon and look at the EventCode=1 for program execution.
Reference: https://docs.microsoft.com/en-us/sysinternals/downloads/sysmon
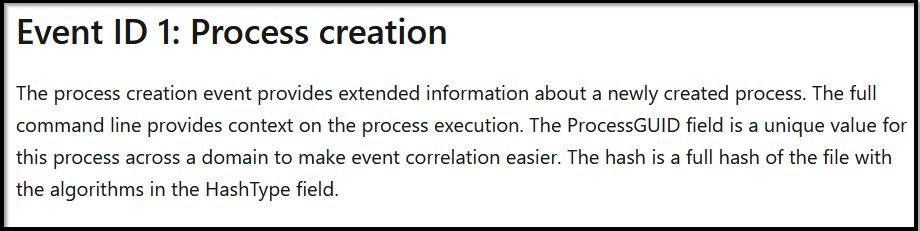
Search Query: index=botsv1 "3791.exe" sourcetype="XmlWinEventLog" EventCode=1
Query Explanation: This query will look for the process Creation logs containing the term “3791.exe” in the logs.
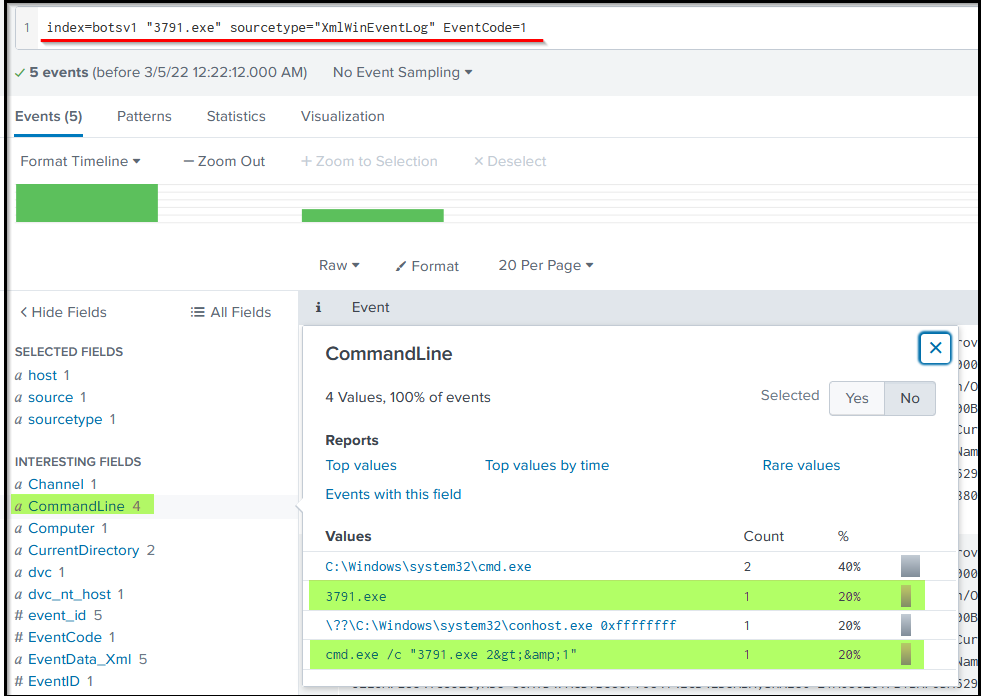
Looking at the output, we can clearly say that this file was executed on the compromised server. We can also look at other host-centric log sources to confirm the result.
Sysmon also collects the Hash value of the processes being created. What is the MD5 HASH of the program 3791.exe?
Answer: AAE3F5A29935E6ABCC2C2754D12A9AF0
Looking at the logs, which user executed the program 3791.exe on the server?
Answer: NT AUTHORITYIUSR
Search hash on the virustotal. What other name is associated with this file 3791.exe?
ab.exe
Action on Objective

As the website was defaced due to a successful attack by the adversary, it would be helpful to understand better what ended up on the website that caused defacement.
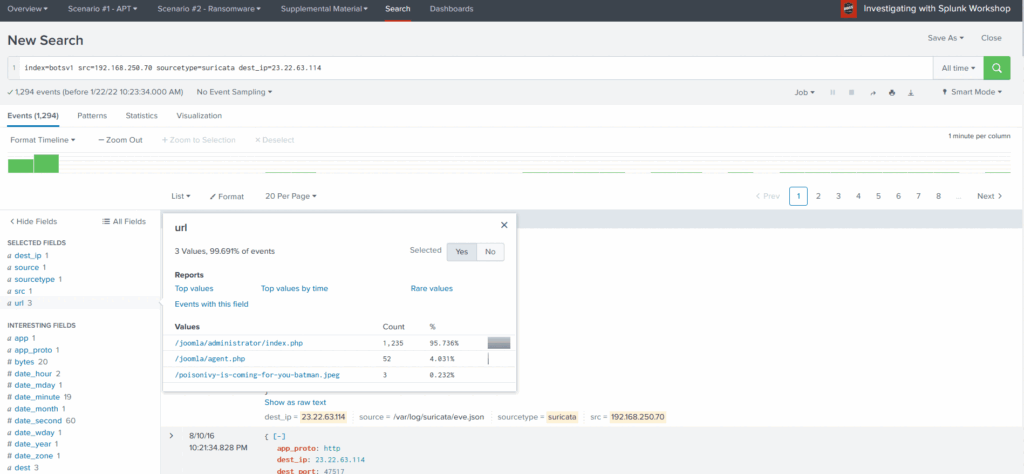
As an analyst, our first quest could be to figure out the traffic flow that could lead us to the answer to this question. There can be a different approach to finding the answer to this question. We will start our investigation by examining the Suricata log source and the IP addresses communicating with the webserver 192.168.250.70.
Search Query:index=botsv1 dest=192.168.250.70 sourcetype=suricata
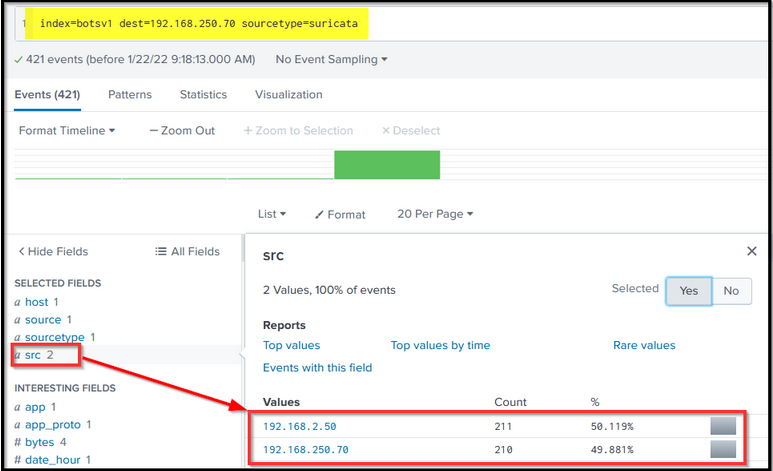
The logs do not show any external IP communicating with the server. Let us change the flow direction to see if any communication originates from the server.
Search Query: index=botsv1 src=192.168.250.70 sourcetype=suricata
What is interesting about the output? Usually, the web servers do not originate the traffic. The browser or the client would be the source, and the server would be the destination. Here we see three external IPs towards which our web server initiates the outbound traffic. There is a large chunk of traffic going to these external IP addresses, which could be worth checking.
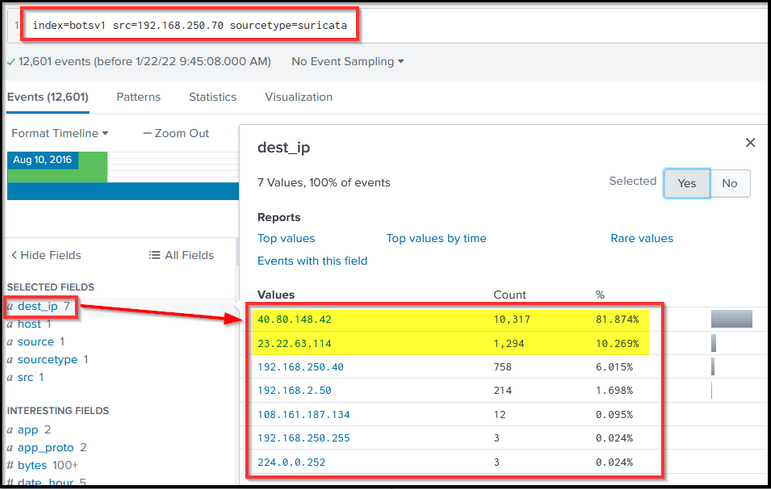
Pivot into the destination IPs one by one to see what kind of traffic/communication is being carried out.
Search Query: index=botsv1 src=192.168.250.70 sourcetype=suricata dest_ip=23.22.63.114
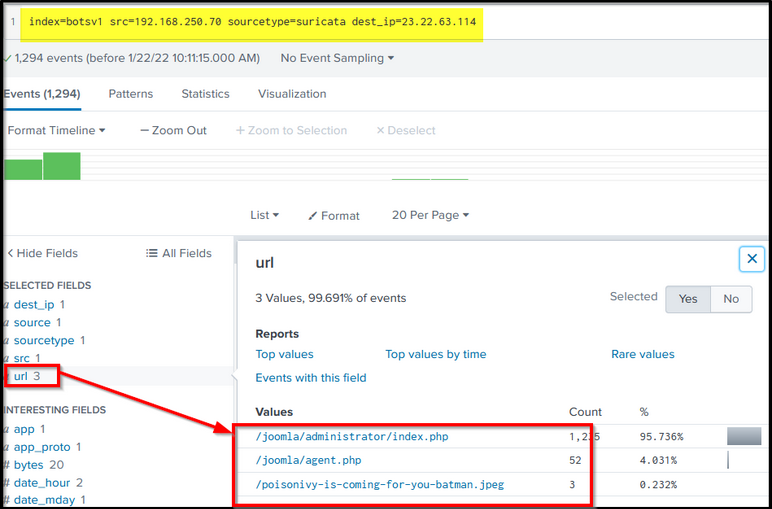
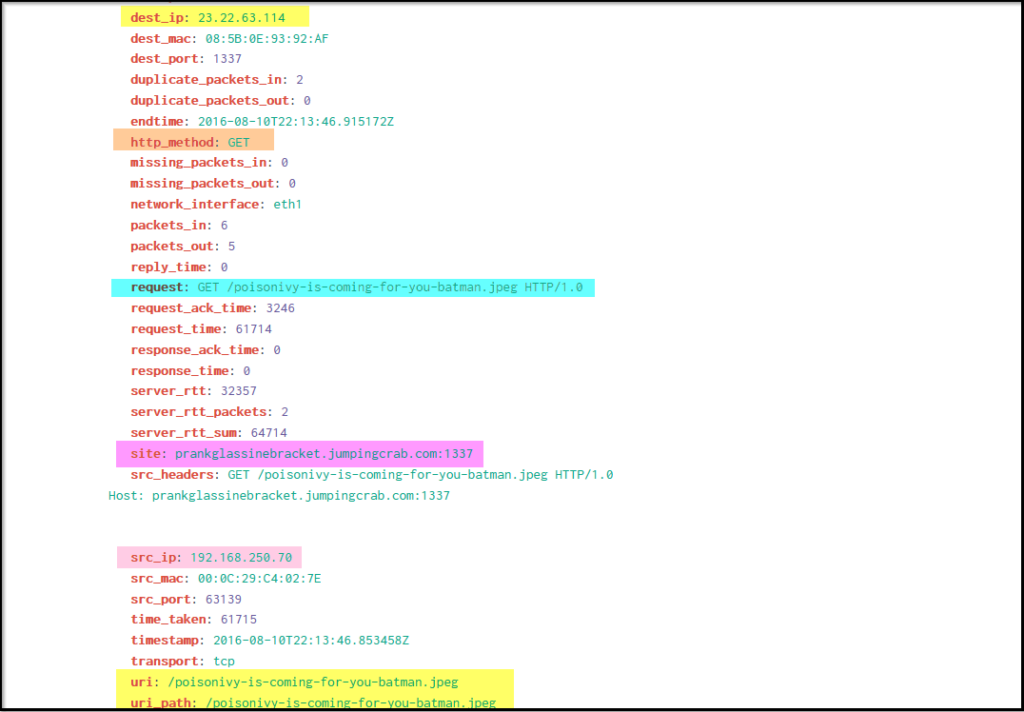
The URL field shows 2 PHP files and one jpeg file. This jpeg file looks interesting. Let us change the search query and see where this jpeg file came from.
Search Query: index=botsv1 url="/poisonivy-is-coming-for-you-batman.jpeg" dest_ip="192.168.250.70" | table _time src dest_ip http.hostname url
The end result clearly shows a suspicious jpeg poisonivy-is-coming-for-you-batman.jpeg was downloaded from the attacker’s host prankglassinebracket.jumpingcrab.com that defaced the site.
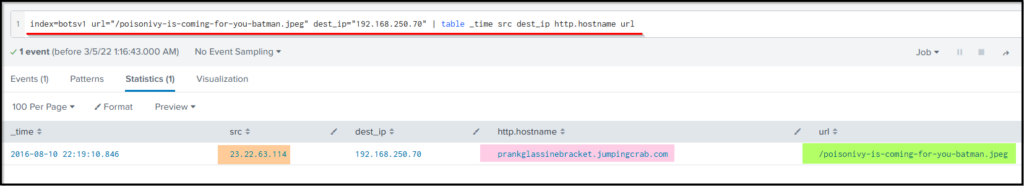
What is the name of the file that defaced the imreallynotbatman.com website ?
Answer: poisonivy-is-coming-for-you-batman.jpeg
Fortigate Firewall ‘fortigate_utm’ detected SQL attempt from the attacker’s IP 40.80.148.42. What is the name of the rule that was triggered during the SQL Injection attempt?
Answer: HTTP.URI.SQL.Injection
Command and Control:

The attacker uploaded the file to the server before defacing it. While doing so, the attacker used a Dynamic DNS to resolve a malicious IP. Our objective would be to find the IP that the attacker decided the DNS.
To investigate the communication to and from the adversary’s IP addresses, we will be examining the network-centric log sources mentioned above. We will first pick fortigate_utm to review the firewall logs and then move on to the other log sources.
Search Query: index=botsv1 sourcetype=fortigate_utm"poisonivy-is-coming-for-you-batman.jpeg"
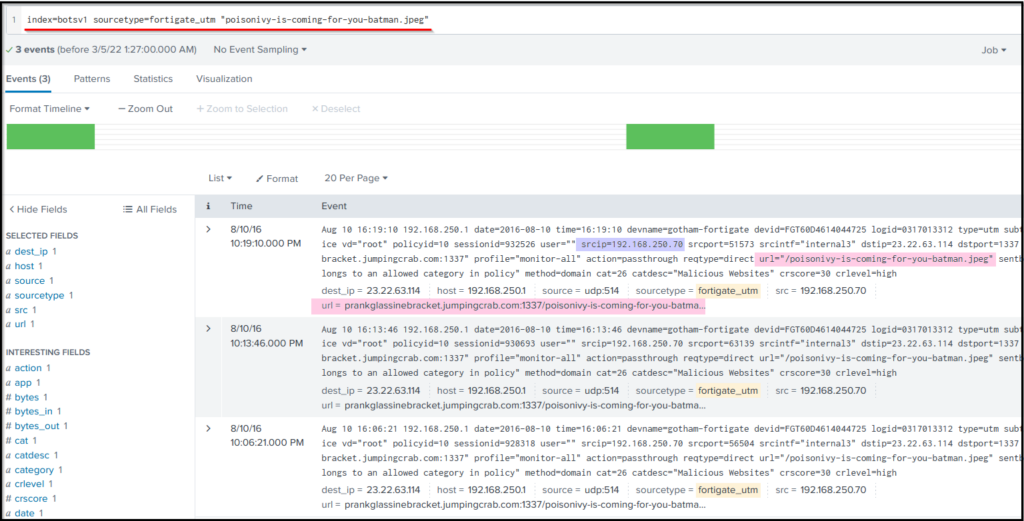
Looking into the Fortinet firewall logs, we can see the src IP, destination IP, and URL. Look at the fields on the left panel and the field url contains the FQDN (Fully Qualified Domain Name).
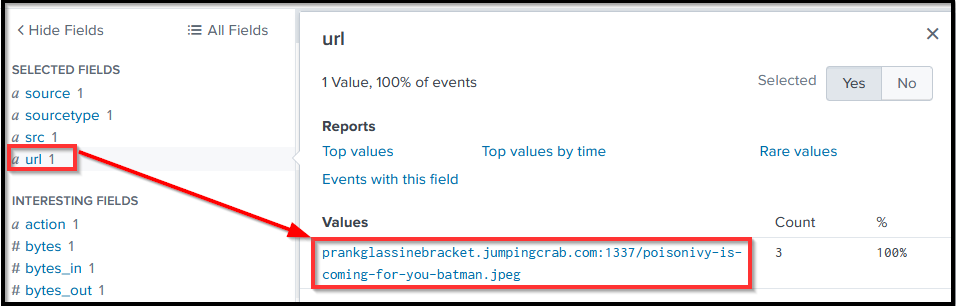
Though we have found the answer, we can verify other log sources.
Let us verify the answer by looking at another log source.
stream:http
.
Search Query: index=botsv1 sourcetype=stream:http dest_ip=23.22.63.114 "poisonivy-is-coming-for-you-batman.jpeg" src_ip=192.168.250.70
We have identified the suspicious domain as a Command and Control Server, which the attacker contacted after gaining control of the server.
Note: We can also confirm the domain by looking at the last log source stream:dns to see what DNS queries were sent from the webserver during the infection period.
This attack used dynamic DNS to resolve to the malicious IP. What fully qualified domain name (FQDN) is associated with this attack?
Answer: prankglassinebracket.jumpingcrab.com
Weaponization

In the weaponization phase, the adversaries would:
- Create Malware / Malicious document to gain initial access / evade detection etc.
- Establish domains similar to the target domain to trick users.
- Create a Command and Control Server for the post-exploitation communication/activity etc.
We have found some domains / IP addresses associated with the attacker during the investigations. This task will mainly look into OSINT sites to see what more information we can get about the adversary.
So far, we have found a domain prankglassinebracket.jumpingcrab.com associated with this attack. Our first task would be to find the IP address tied to the domains that may potentially be pre-staged to attack Wayne Enterprise.
In the following exercise, we will be searching the online Threat Intel sites for any information like IP addresses/domains / Email addresses associated with this domain which could help us know more about this adversary.
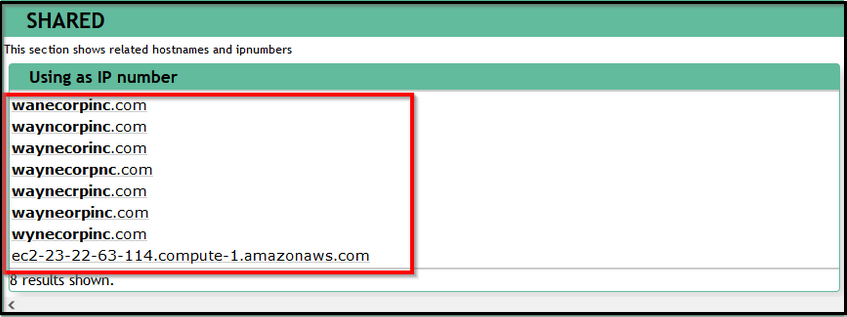
Robtex:Robtex is a Threat Intel site that provides information about IP addresses, domain names, etc.
Please search for the domain on the robtex site and see what we get. We will get the IP addresses associated with this domain.
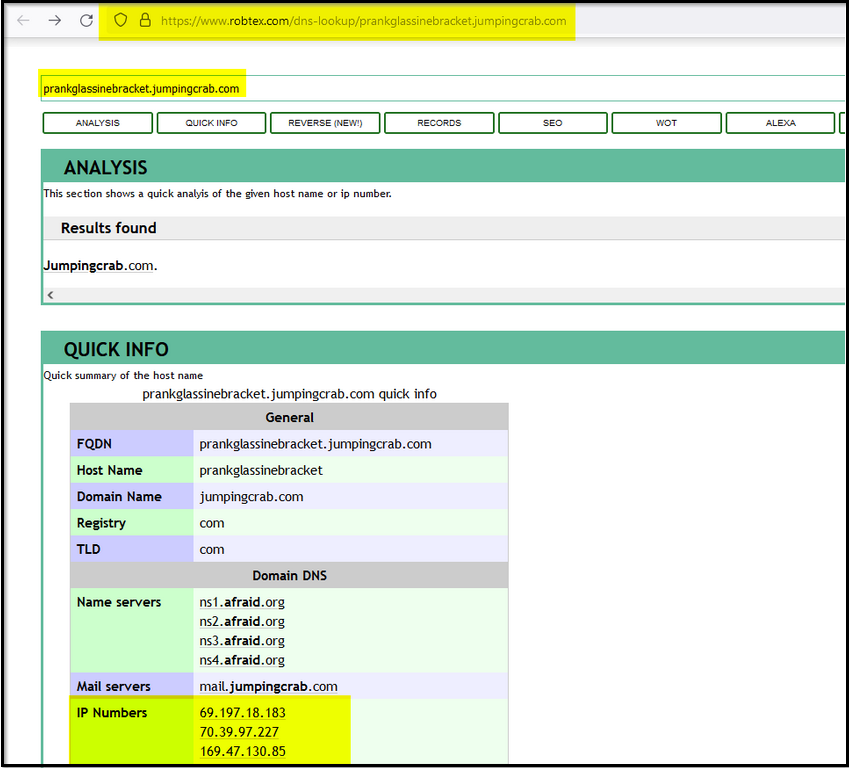
Some domains/subdomains associated with this domain:
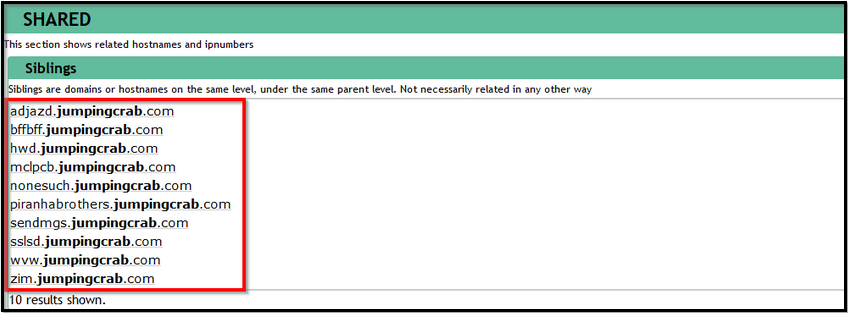
Reference: https://www.robtex.com/dns-lookup/prankglassinebracket.jumpingcrab.com
Next, search for the IP address 23.22.63.114 on this Threat Intel site.
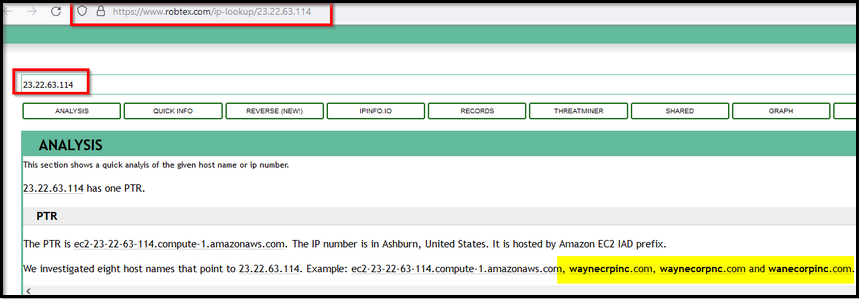
What did we find? this IP is associated with some domains that look pretty similar to the WAYNE Enterprise site.
Reference: https://www.robtex.com/ip-lookup/23.22.63.114
Virustotal
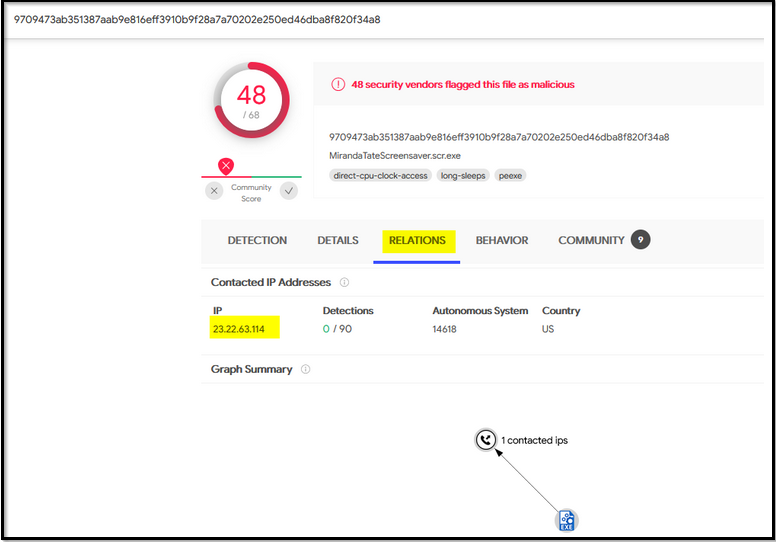
Virustotal is an OSINT site used to analyze suspicious files, domains, IP, etc. Let’s now search for the IP address on the virustotal site. If we go to the RELATIONS tab, we can see all the domains associated with this IP which look similar to the Wayn Enterprise company.
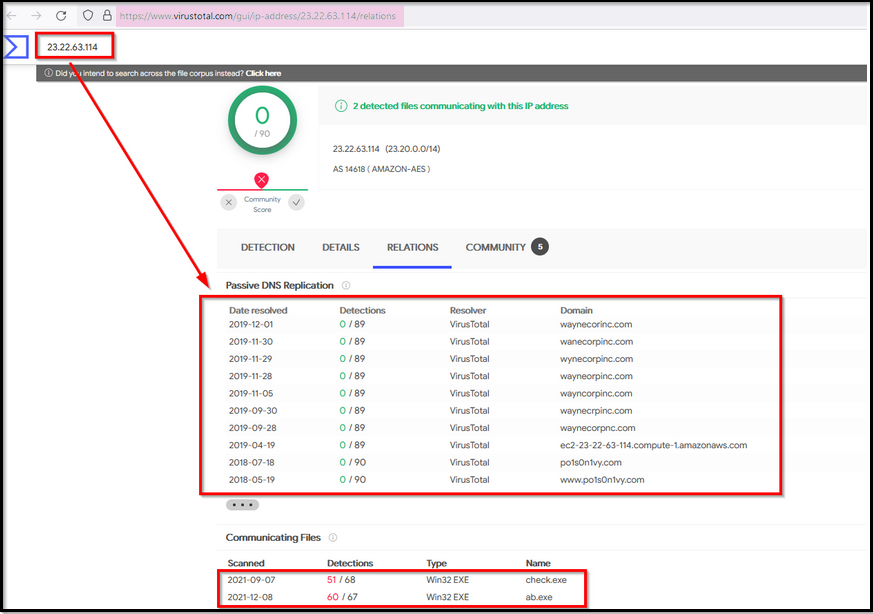
In the domain list, we saw the domain that is associated with the attacker www.po1s0n1vy.com . Let us search for this domain on the virustotal.
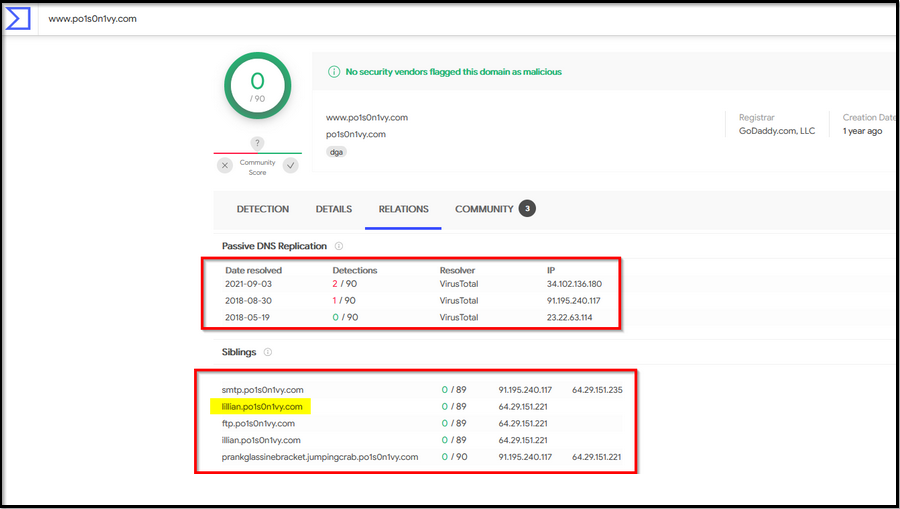
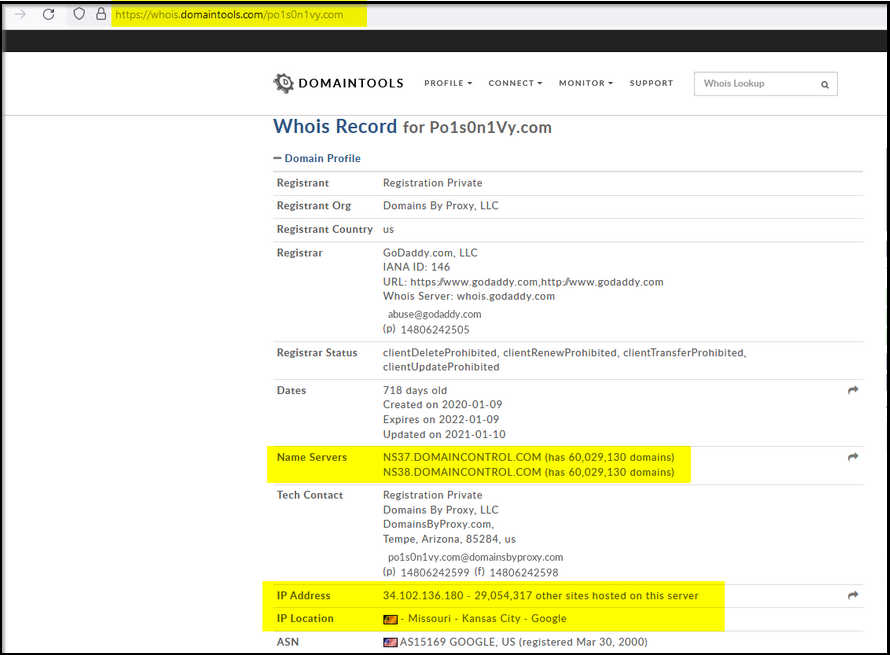
We can also look for the whois information on this site -> whois.domaintools.com to see if we can find something valuable.
What IP address has P01s0n1vy tied to domains that are pre-staged to attack Wayne Enterprises?
Answer: 23.22.63.114
Based on the data gathered from this attack and common open-source intelligence sources for domain names, what is the email address that is most likely associated with the P01s0n1vy APT group?
Answer: [email protected]
Delivery

Attackers create malware and infect devices to gain initial access or evade defenses and find ways to deliver it through different means. We have identified various IP addresses, domains and Email addresses associated with this adversary. Our task for this lesson would be to use the information we have about the adversary and use various Threat Hunting platforms and OSINT sites to find any malware linked with the adversary.
Threat Intel report suggested that this adversary group Poison lvy appears to have a secondary attack vector in case the initial compromise fails. Our objective would be to understand more about the attacker and their methodology and correlate the information found in the logs with various threat Intel sources.
OSINT sites
- Virustotal
- ThreatMiner
- Hybrid-Analysis
ThreatMiner
Let’s start our investigation by looking for the IP 23.22.63.114 on the Threat Intel site ThreatMiner.
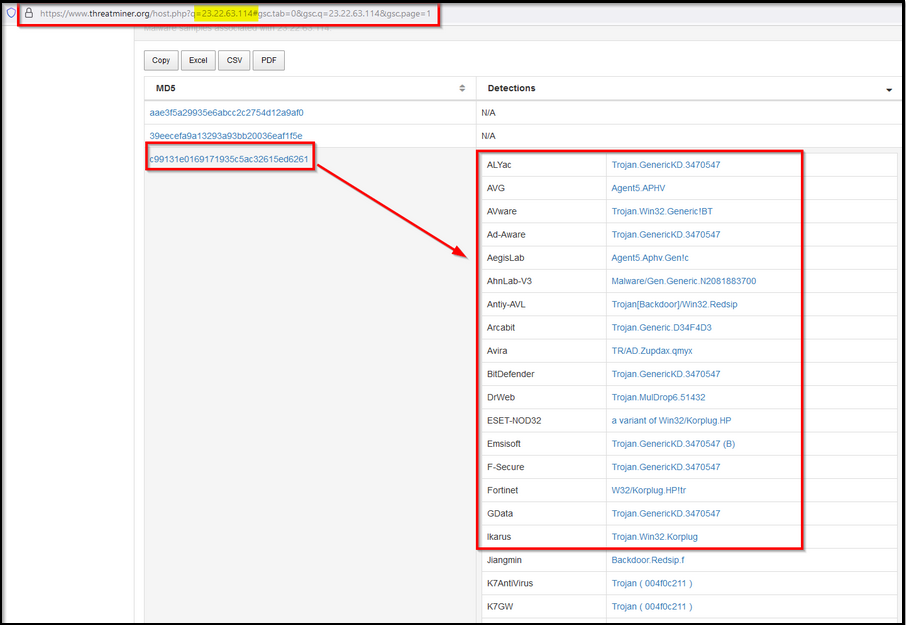
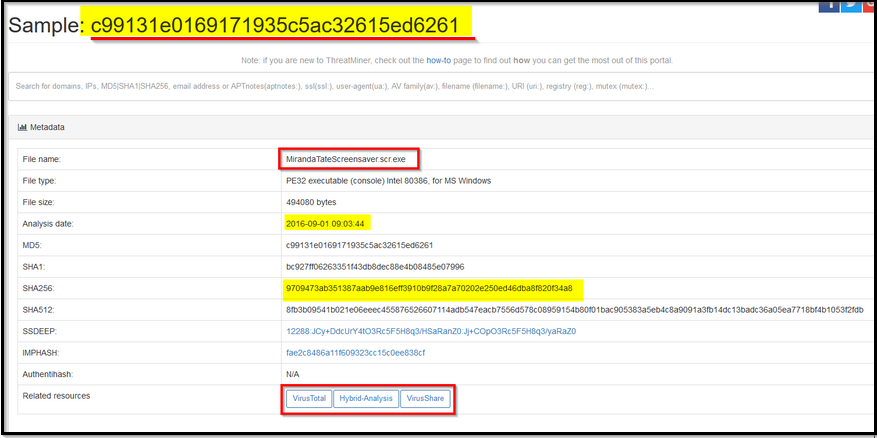
We found three files associated with this IP, from which one file with the hash value c99131e0169171935c5ac32615ed6261 seems to be malicious and something of interest.
Now, click on this MD5 hash value to see the metadata and other important information about this particular file.
Reference: https://www.threatminer.org/host.php?q=23.22.63.114#gsc.tab=0&gsc.q=23.22.63.114&gsc.page=1
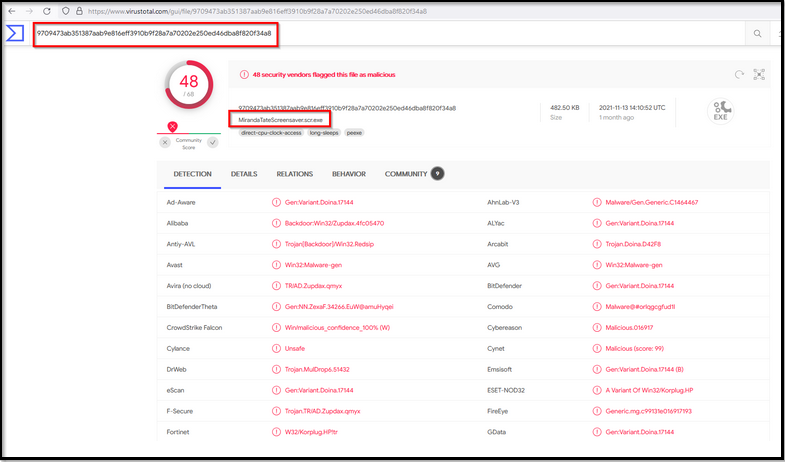
Virustotal
Open virustotal.com and search for the hash on the virustotal now. Here, we can get information about the metadata about this Malware in the Details tab.
Hybrid-Analysis
Hybrid Analysis is a beneficial site that shows the behavior Analysis of any malware. Here you can look at all the activities performed by this Malware after being executed. Some of the information that Hybrid-Analysis provides are:
- Network Communication.
- DNS Requests
- Contacted Hosts with Country Mapping
- Strings
- MITRE ATT&CK Mapping
- Malicious Indicators.
- DLLs Imports / Exports
- Mutex Information if created
- File Metadata
- Screenshots
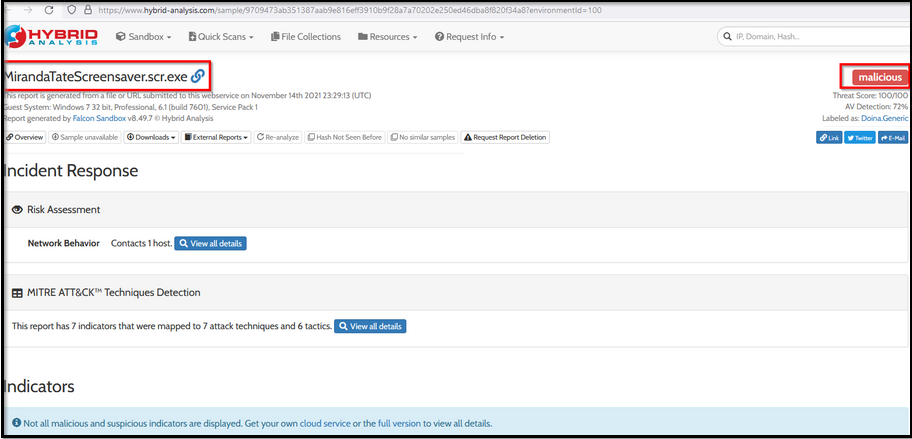
Scroll down, and you will get a lot of information about this Malware.
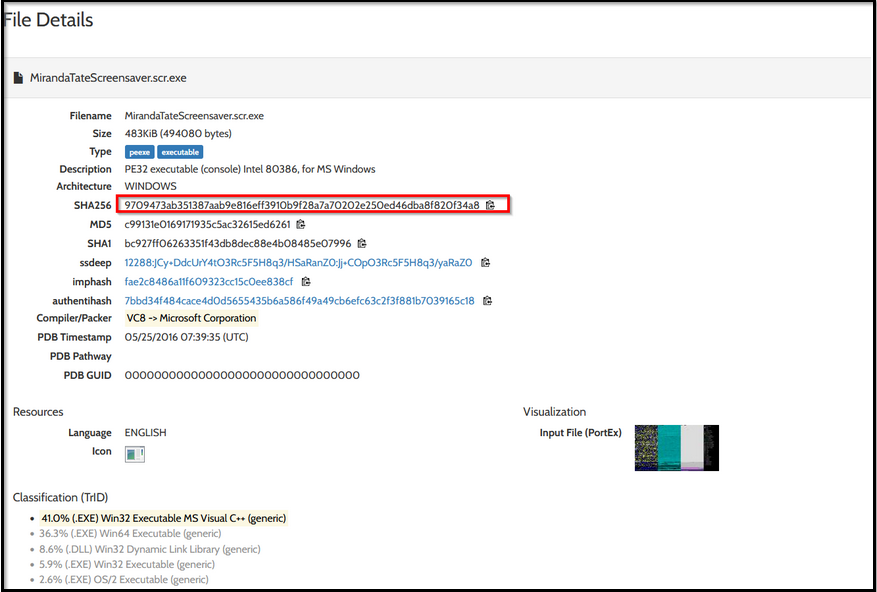
What is the HASH of the Malware associated with the APT group?
Answer: c99131e0169171935c5ac32615ed6261
What is the name of the Malware associated with the Poison Ivy Infrastructure?
Answer: MirandaTateScreensaver.scr.exe
Conclusion:
In this fun exercise, as a SOC Analyst, we have investigated a cyber-attack where the attacker had defaced a website ‘imreallynotbatman.com’ of the Wayne Enterprise. We mapped the attacker’s activities into the 7 phases of the Cyber Kill Chain. Let us recap everything we have found so far:
Reconnaissance Phase:
We first looked at any reconnaissance activity from the attacker to identify the IP address and other details about the adversary.
Findings:
- IP Address
40.80.148.42was found to be scanning our webserver. - The attacker was using Acunetix as a web scanner.
Exploitation Phase:
We then looked into the traces of exploitation attempts and found brute-force attacks against our server, which were successful.
Findings:
- Brute force attack originated from IP
23.22.63.114. - The IP address used to gain access:
40.80.148.42 - 142 unique brute force attempts were made against the server, out of which one attempt was successful
Installation Phase:
Next, we looked at the installation phase to see any executable from the attacker’s IP Address uploaded to our server.
Findings:
- A malicious executable file
3791.exewas observed to be uploaded by the attacker. - We looked at the sysmon logs and found the MD5 hash of the file.
Action on Objective:
After compromising the web server, the attacker defaced the website.
Findings:
- We examined the logs and found the file name used to deface the webserver.
Weaponization Phase:
We used various threat Intel platforms to find the attacker’s infrastructure based on the following information we saw in the above activities.
Information we had:
Domain: prankglassinebracket.jumpingcrab.com
IP Address:
23.22.63.114
Findings:
- Multiple masquerading domains were found associated with the attacker’s IPs.
- An email of the user
[email protected]was also found associated with the attacker’s IP address.
Deliver Phase:
In this phase, we again leveraged online Threat Intel sites to find malware associated with the adversary’s IP address, which appeared to be a secondary attack vector if the initial compromise failed.
Findings:
- A malware name
MirandaTateScreensaver.scr.exewas found associated with the adversary. - MD5 of the malware was
c99131e0169171935c5ac32615ed6261
What an absolute monster of a room. Learnt a lot, would be great to be quicker at many of these techniques. Thanks for reading.


Leave a Reply